
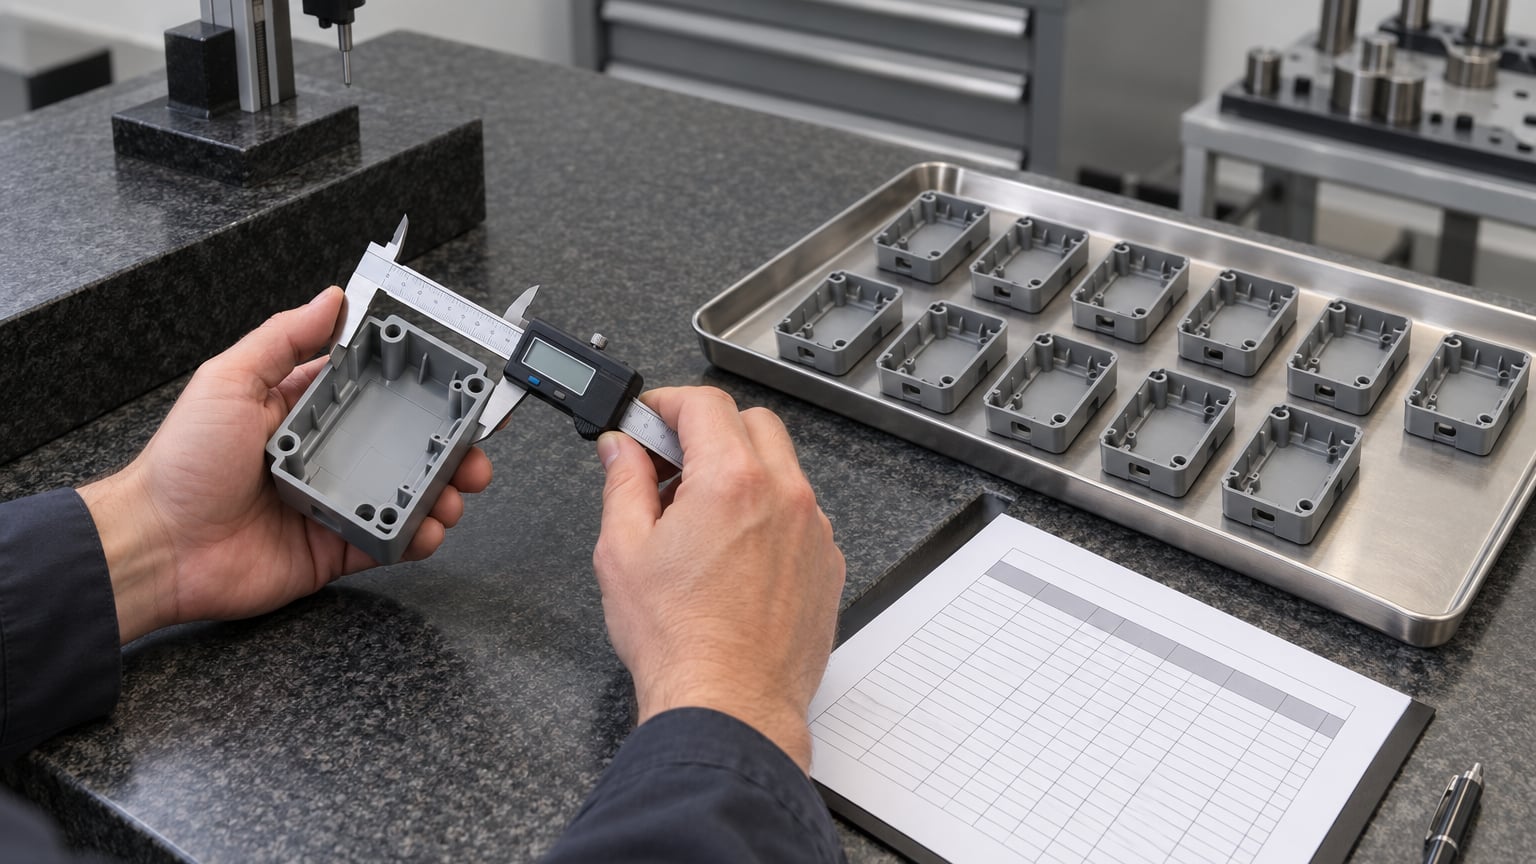
If you want to know how to do a gage R&R study, the short answer is this: have three operators each measure ten representative parts twice with the same gage, in a randomized order, then analyze the 60 readings to split total variation into equipment variation, appraiser variation, and part-to-part variation. The standard design most shops use is 10 parts by 3 operators by 2 to 3 trials. Plan for a half day of floor time plus a couple of hours at the desk, and the work is very doable in-house without a consultant.
The reason it matters is uncomfortable. A gage R&R study is not about whether the instrument reads correctly against a master. It is about how much of the spread you see in your process data is the parts, and how much is the measurement noise. Get that ratio wrong and every capability index, control chart limit, and pass/fail call built on those readings is built on sand.
What follows is the full procedure as I would run it, including the parts that get skipped in most write-ups: how to pick parts that actually reveal variation, why operators should master the gage themselves, what to check before you trust the data, and what to change when a study fails.
Table of Contents
- What You Need
- Step-by-Step: How to Do a Gage R&R Study
- 1. Define the Parts, Operators, and Measurement Method
- 2. Plan the Study and Randomize the Measurements
- 3. Collect and Check the Data
- 4. Calculate Repeatability and Reproducibility
- 5. Interpret the Study Variation and Acceptance Criteria
- 6. Investigate and Improve an Unacceptable Measurement System
- 7. Document and Approve the Results
- Common Mistakes
- Frequently Asked Questions
- How many parts, operators, and trials do I need for a gage R and R study?
- Can I do a gage R and R in Excel?
- How do I interpret the % gage R and R result?
- Why did my gage fail R and R even though it is calibrated?
- How often should you repeat a gage R and R study?
- Should each operator zero or master the gage during the study?
- Conclusion
What You Need
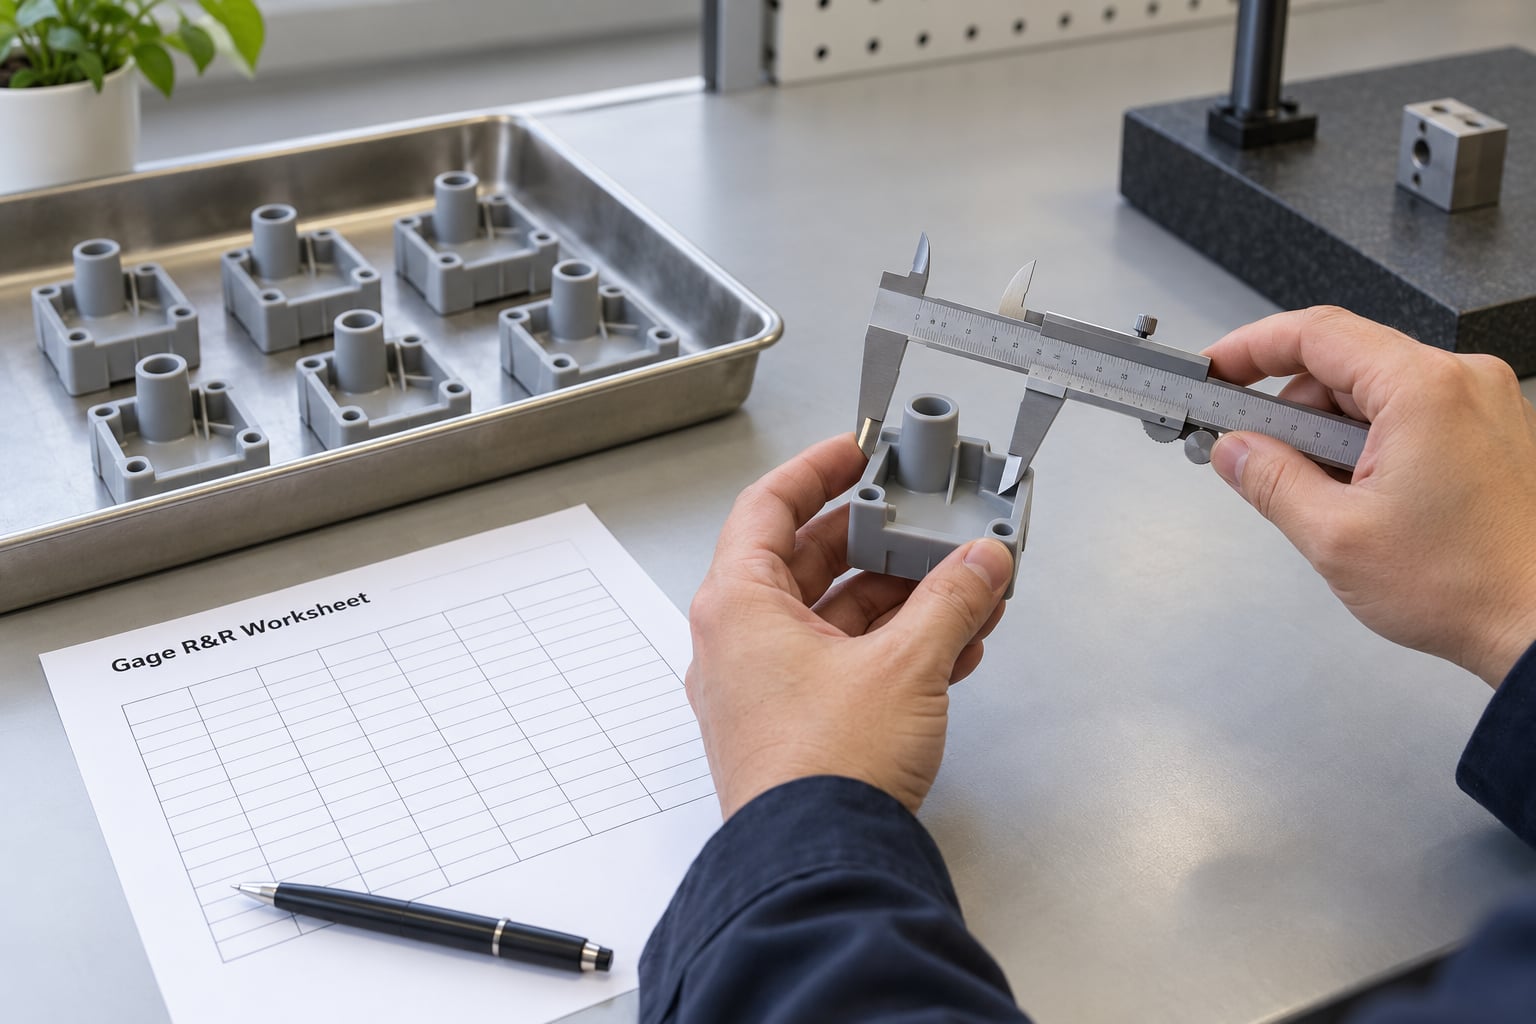
Six things have to be settled before anyone picks up a gage. Miss any one of them and the numbers come out, but they answer a question nobody asked.
- The measurement system itself. The actual gage that ships in production, on the actual fixture or in the actual fixturing. A lab bench instrument that will never touch the floor gives you a study of the wrong thing.
- Ten representative parts. Pulled from the production stream and spanning the real operating range of the process, including the region where good parts live.
- Three operators. The people who will actually take the readings, including the best and the newest. One operator alone produces repeatability data only.
- Two to three trials per part per operator. Trials, not operators. Two is the minimum; three gives you a better handle on repeatability.
- A written measurement procedure. Where to locate the gage on the feature, how to seat it, how much force to apply, how to read the scale, and how to clean between parts.
- An analysis method. The AIAG MSA worksheets that ship inside the MSA Reference Manual, or statistical software such as Minitab or JMP.
The design above is a crossed study, where every operator measures every part. It suits a durable, production-representative part measured non-destructively, which is the overwhelming majority of cases. A nested study is the other option, and it is used when parts cannot be re-measured, so operator A measures parts 1 through 5 and operator B measures parts 6 through 10. You lose the ability to separate the operator-by-part interaction, so treat a nested result as directional rather than final.
Here is the design at a glance.
| Design element | Standard choice | Why it matters |
|---|---|---|
| Parts | 10 | Enough to estimate the part-to-part spread and to test the analysis assumptions |
| Operators | 3 | Separates operator-to-operator variation from repeatability |
| Trials per part | 2 to 3 | Produces the repeated readings that define equipment variation |
| Total readings | 60 to 90 | The full data set the analysis consumes |
| Study type | Crossed | All operators measure all parts; interaction becomes visible |
| Method | ANOVA | Separates interaction and gives confidence intervals; average-and-range is the fallback |
On the standards side, the acceptance bands used throughout this guide come from the AIAG MSA Reference Manual, 4th Edition, which is the reference most quality systems point at. ISO 9001 Clause 7.1.5.1 and IATF 16949 both require you to demonstrate that your monitoring and measuring equipment is fit for purpose, and a documented R&R study is the usual proof. ISO/IEC 17025 governs the calibration lab that certifies the instrument. None of them dictate 10 percent. That number comes from the MSA manual and from long practice, and it is a guideline you are allowed to argue with if your process and tolerances justify it.
Step-by-Step: How to Do a Gage R&R Study
1. Define the Parts, Operators, and Measurement Method
Part selection is where most studies go wrong, and it is the step nobody wants to own. A random sample of ten parts from the last hour of production often has almost no spread, which makes the gage look good by accident. What you want is ten parts that span the process as it actually runs, from the low end of the normal operating range to the high end, ideally with a couple near the specification limits.
There is a real debate here and it is worth knowing both sides. One camp takes ten consecutive production parts, arguing that this is what the gage sees day to day. The other camp deliberately selects parts that span the out-of-tolerance range, arguing that you need to know how the gage behaves near the limits where the accept/reject decisions get made. My take, after watching a lot of these studies land on desks: take a random production sample, then confirm the spread. If the range of your ten parts is much narrower than the tolerance, deliberately add parts from the far end of the observed range so the study covers the decisions you care about.
Operators should be the three people who will use the gage, not three volunteers who are available that afternoon. Include your most experienced operator and your newest. That contrast is the entire point of the reproducibility component.
Write the measurement method down before anyone starts. Gage location, the feature and datum, seating method, applied force, reading point, number of decimal places to record, and cleaning between parts. If two operators can read that page and measure the same part the same way, you have a procedure. If they argue about it, you have found your reproducibility problem early and cheaply.
Record data in a layout that matches the crossed study, one row per part, one column per operator-trial combination. This is the AIAG worksheet format.
| Part | Op 1 T1 | Op 1 T2 | Op 1 T3 | Op 2 T1 | Op 2 T2 | Op 2 T3 | Op 3 T1 | Op 3 T2 | Op 3 T3 |
|---|---|---|---|---|---|---|---|---|---|
| 1 | 25.42 | 25.38 | 25.44 | 25.40 | 25.36 | 25.41 | 25.39 | 25.43 | 25.37 |
| 2 | 25.51 | 25.48 | 25.52 | 25.47 | 25.50 | 25.49 | 25.46 | 25.53 | 25.45 |
| 3 | 25.35 | 25.33 | 25.37 | 25.31 | 25.34 | 25.36 | 25.30 | 25.32 | 25.38 |
| 4 | 25.60 | 25.55 | 25.58 | 25.52 | 25.57 | 25.54 | 25.49 | 25.56 | 25.53 |
| 5 | 25.44 | 25.41 | 25.46 | 25.39 | 25.43 | 25.40 | 25.37 | 25.45 | 25.42 |
| 6 | 25.68 | 25.62 | 25.65 | 25.59 | 25.64 | 25.61 | 25.56 | 25.63 | 25.58 |
| 7 | 25.29 | 25.25 | 25.31 | 25.24 | 25.28 | 25.26 | 25.22 | 25.27 | 25.30 |
| 8 | 25.55 | 25.50 | 25.57 | 25.47 | 25.53 | 25.49 | 25.45 | 25.54 | 25.51 |
| 9 | 25.38 | 25.34 | 25.40 | 25.30 | 25.36 | 25.32 | 25.28 | 35.37 | 25.35 |
| 10 | 25.47 | 25.43 | 25.49 | 25.39 | 25.45 | 25.41 | 25.36 | 25.44 | 25.38 |
That sample set is deliberately realistic. The Part 9 reading in the Operator 3 second trial column is a typo, and finding it is Step 3’s job.
2. Plan the Study and Randomize the Measurements
Randomization is what separates a study that measures the measurement system from one that measures three people’s short-term memory.
- Assign each part a blind ID. Have someone else label the parts 101 through 110 so the operator cannot infer anything from the number.
- Build a run order that mixes parts and operators rather than letting one operator sweep all ten parts in sequence.
- Rotate or re-randomize the part order on day two and day three so nobody can recall their earlier reading.
- Measure under production conditions, on the line, at normal cycle pace, with the fixture or fixturing operators actually use.
- Have each operator master or zero the gage themselves, exactly the way they do in production.
That last point generates more argument than any other in the discipline, so let me lay it out. Practitioners who post on metrology forums generally argue that if metrology zeroes the instrument once, locks it, and hands it over, you have measured operator technique alone and learned nothing about accuracy against an accepted value. Let each operator master the gage the way production does and the study reflects the real measurement loop. The counter-argument is fair: an untrained operator may master it badly, and that shows up as reproducibility rather than being controlled for.
I run it the production way. The whole point is to characterize the system as it exists, defects included.
One more habit worth stealing: deliberately un-zero the gage between measurement checks rather than re-zeroing it to a perfect master each time. That forces the real variables into the study and exposes systematic error that repeated perfect zeroing would hide.
Also avoid reference standards with the nominal size stamped on them. Experienced practitioners lap a gauge block slightly undersize so the person checking has no anchor to bias toward a printed number.
3. Collect and Check the Data
Run through this checklist before you touch the analysis. It takes ten minutes and it saves an afternoon.
- Units are consistent on every row and match the drawing.
- Decimal precision matches the gage resolution. If the gage reads to 0.01 mm, do not record three decimals.
- Part IDs are present, unique, and consistent across all operator columns.
- Every expected cell is filled. Sixty readings for a 10 by 3 by 2 design, ninety for 10 by 3 by 3.
- No impossible values. A transcription slip shows up immediately as a reading that is off by a power of ten or a digit swap.
- Outliers are investigated, not deleted. A single wild reading often means a mislabeled part or a gage knocked out of position, and both are findings.
- No part was measured twice by the same operator back to back without repositioning in between.
In the worksheet above, the Part 9 reading of 35.37 where the neighborhood is 25.35 is a classic digit error. The correct handling is to re-measure that cell if the part is still available, or to document the correction and its cause. Silently deleting the row makes the study look better and teaches you nothing.
4. Calculate Repeatability and Reproducibility
The ANOVA method is the right default. The average-and-range method is a fallback for small studies and it cannot separate interaction from error, so it understates total gage variation in studies where operators behave differently on different parts.
The ANOVA breaks the total variation into five sources:
- Part to part (PV) — the real spread in the parts. This is the signal you want to keep.
- Operator to operator (AV) — differences between how the three people take readings.
- Operator by part interaction — cases where one operator reads differently on different parts, which is usually a fixturing or technique effect.
- Repeatability, or equipment variation (EV) — the same operator, same gage, same part, twice in a row.
- Reproducibility — the wider loop including operator differences, part handling, and fixture swaps.
The combined relationship is what most people are looking for when they ask about the formula:
Gage R&R = Repeatability (EV) + Reproducibility (AV), where AV includes operator variation and the operator-by-part interaction.
And the reported percentage is study variation of GR&R over study variation of total variation. Total variation is the sum of GR&R and PV. This is the step where most searches for how to do a gage R&R study get stuck, because the formula is trivial and the assumptions behind it are not.
Minitab handles all of this without manual algebra. Enter the part IDs in the first column, the operator-trial readings in columns two through seven, and then choose Stat, Quality Tools, Measurement System Analysis, Gage Study, Crossed. Check the process order and subgroup values, confirm the Part field and Operator field are assigned, and Minitab returns the variance table, the X-bar chart by operator, the range chart, and the histogram. The Results dialog can be opened from any output row, and it holds the expanded confidence intervals most audits ask for.
For Excel users, the average-and-range method is the practical route. Build the raw data with parts in rows and operator-trial pairs in columns, compute a part average and a part range, then compute an operator average range and a part-to-part range. Multiply the average range by the appropriate K factor to get EV and AV, then divide the combined gage variation by total variation and multiply by 100. The AIAG MSA worksheets are pre-built Excel files that do this arithmetic for you and are the safer choice if you are reporting to an auditor, because the layout is already in the expected format.
Here is what a finished variance table looks like, with a typical passing study.
| Source | Degrees of freedom | % Contribution | % Study Variation |
|---|---|---|---|
| Total variation | 59 | 100.00 | 100.00 |
| Part to part | 9 | 87.40 | 93.51 |
| Total Gage R&R | 38 | 11.20 | 5.96 |
| Repeatability | 30 | 3.10 | 3.11 |
| Reproducibility | 8 | 8.10 | 4.32 |
| Operator | 2 | 6.20 | 3.68 |
| Operator by part | 6 | 1.90 | 1.99 |
The two percentage columns answer different questions and both belong in a report. % Contribution expresses each variance component as a proportion of total variance. % Study Variation expresses each as a proportion of the six-standard-deviation spread, which is what relates to the tolerance decision. A study that looks acceptable on one column and marginal on the other is common, and when the two disagree, report both and explain which one drove your decision.
If you want the equivalence shortcut, % Study Variation of 30 percent for GR&R corresponds to roughly 91 percent % Contribution for part-to-part variation. Any gauge-versus-part ratio can be decided from either side.
5. Interpret the Study Variation and Acceptance Criteria
These bands come from the AIAG MSA Reference Manual, 4th Edition. Read them as guidance for typical manufacturing tolerances, not as law.
| % Gage R&R (of study variation) | Verdict | Action required | Typical root cause |
|---|---|---|---|
| Under 10% | Acceptable | Use the gage for production decisions as documented | None; well-behaved measurement system |
| 10% to 30% | Marginal to conditionally acceptable | Acceptable only with a documented plan of improvement, or where the tolerance is generous | Operator technique, resolution slightly coarse, moderate repeatability |
| Above 30% | Unacceptable | Improve the system and re-run before using it for pass/fail or capability decisions | Coarse resolution, subjective reading, inconsistent method, poor fixturing |
Tolerance context matters more than the number. A gage at 15 percent of study variation can be perfectly workable on a characteristic with a total tolerance of ten millimeters and unusable on one with a tolerance of 0.1. Some shops tighten their internal gate to under 10 percent for safety-critical characteristics and relax to 20 percent for cosmetic ones. Whatever gate you set, write it down before the study so the decision is not reverse-engineered after the fact.
The number of distinct categories, NDC, gives you a second read. It is the count of groups the measurement system can reliably separate from each other, where the divisor is 1.41 times the standard deviation of the gage variation. Five or more is preferred. Below three means the system cannot reliably tell good parts from bad ones, no matter how good the percentage looks.
Two more checks before you sign anything. If the ANOVA shows a non-additive pattern, the p-value for the interaction term falls below 0.05 and you should look at the X-bar chart by operator for offset or drift patterns before trusting the additive numbers. And if the variance components come back negative, the study lacks enough trials or the parts do not span enough range. Fix the design and re-run.
6. Investigate and Improve an Unacceptable Measurement System
The variance table tells you which door to open. Work down the list below in the order that matches your dominant variation component.
If repeatability is high, the gage itself is the problem. Check resolution first. A gage that reads to 0.01 on a tolerance of plus or minus 0.02 is guessing. Confirm the calibration is current and NIST-traceable, then inspect the instrument for burrs, worn anvils, a dial that sticks, or a spindle that is not moving cleanly. Try a different fixture or a better seating surface. Manual presses and hand-held bore gauges are where repeatability quietly goes to die.
If reproducibility is high, it is a people and method problem. Watch two operators measure the same part without telling them they are being watched. The differences you see are the ones your customers see. Fix the written procedure, add photographs or a datum callout, retrain, and qualify against a baseline: once you have a known operator variation from a good study, you can qualify a new hire by comparing their readings to it.
If the interaction term dominates, look at fixturing and part handling. Interaction means operators disagree about some parts more than others, which usually means the feature is hard to locate consistently. Improve the jig, define the measurement point relative to a physical datum rather than a drawn dimension, and reduce the part-to-part surface variation that makes the feature hard to seat.
Across all three, one habit pays off repeatedly: screen before you commit. Run a quick bare Gage R, which is just repeated readings by one operator on one part, to validate the fixture. Under 10 percent there means you have a workable setup and can proceed to the full study. Spending twenty minutes on the screen saves a day of collecting data you were always going to throw out.
Then re-run the study. A corrective action without a follow-up study is an opinion.
7. Document and Approve the Results
A report an auditor accepts contains all of the following.
- Study date, process, part number, and characteristic being measured.
- Gage identification, type, resolution, and calibration status on the study date.
- Part identification method and a note on how the range was established.
- Operator identification, including training status.
- Number of parts, operators, trials, and total readings.
- Randomization method and whether operators self-mastered the gage.
- Analysis method used, and the software and version.
- Variance component table with % contribution and % study variation.
- Number of distinct categories.
- The acceptance criteria applied and the resulting decision.
- Any assumption caveats, outliers corrected, and what the study does not prove.
- Corrective actions, owners, and due dates if the result is marginal or unacceptable.
- Approval signature from quality and the process owner.
Be explicit about what the study does not prove. It does not prove the gage is accurate against a national standard, which is what calibration establishes. It does not prove the measurement is bias-free. And a passing R&R on a slow, careful shop-floor study does not guarantee the same result on a fast line. Saying so in the report reads as competence, not weakness.
Common Mistakes
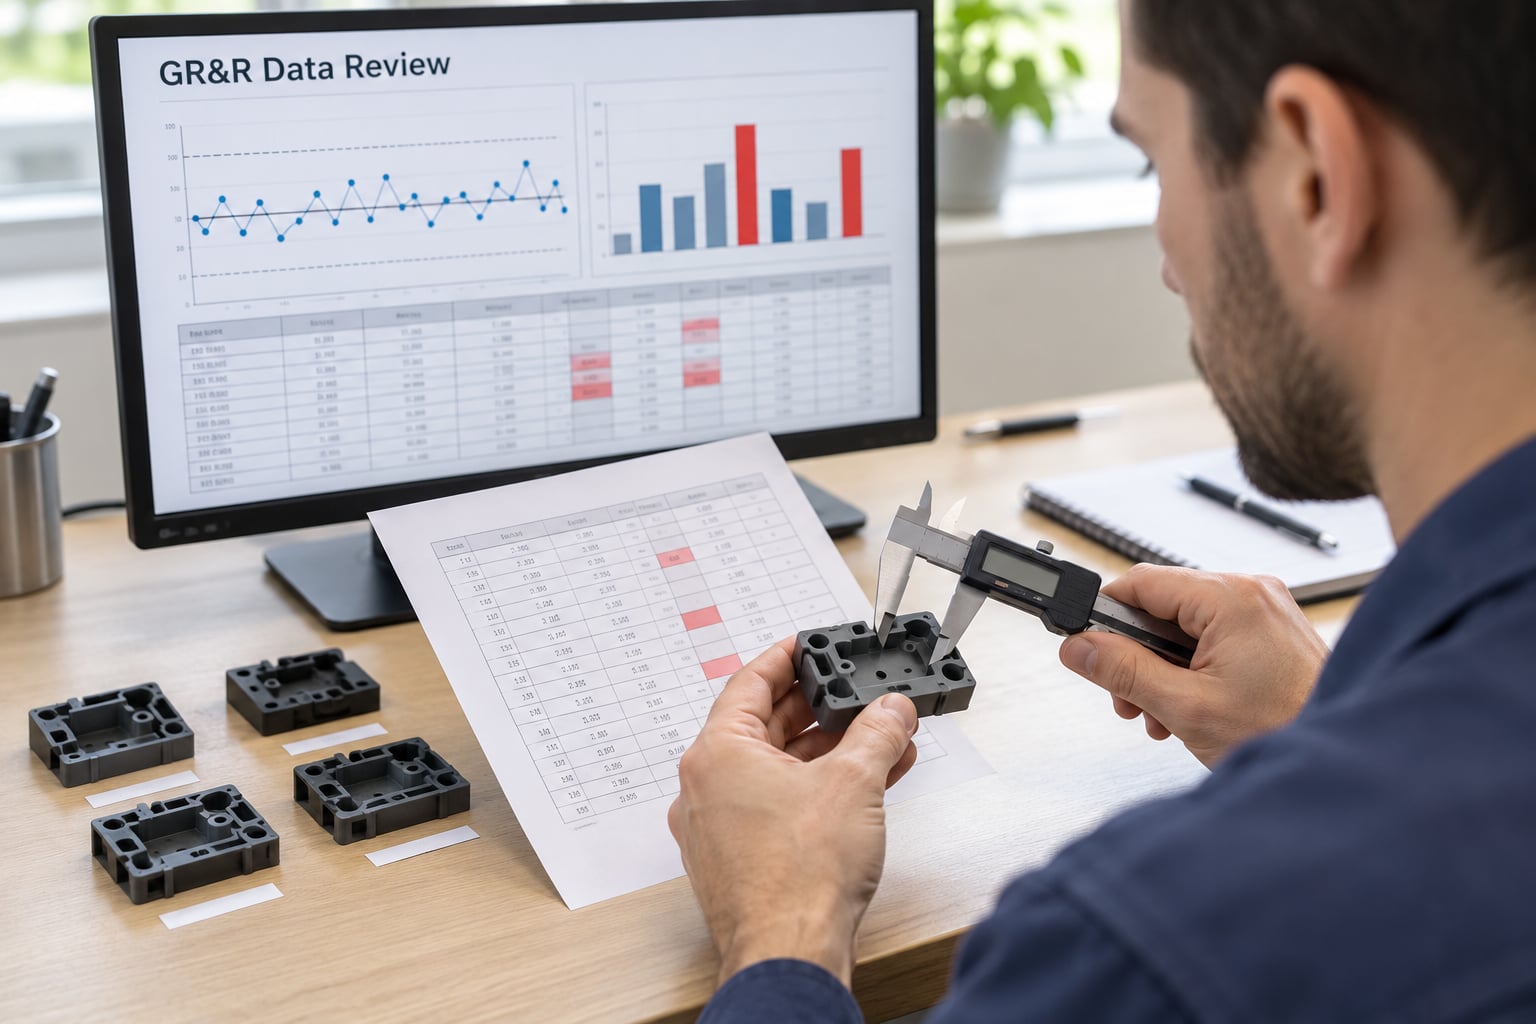
These are the errors that recur, roughly in the order I run into them.
Too few parts. Ten is the floor, not a preference, and the parts must span the process range. Fix: pull a larger candidate pool and select ten that genuinely cover the operating range, with a note in the report explaining the selection.
Too few operators, or the wrong ones. Two operators cannot reliably estimate the interaction, and three people who never use the gage produce a flattering study. Fix: use three, including your newest hire, and document their experience level.
Nonrandom measurement order. Running all ten parts in sequence lets an operator unconsciously repeat a remembered reading and inflates apparent repeatability. Fix: randomize per operator and rotate the order between trial days.
Unblinded parts. When the operator can see the part number and knows it is part 7 of 10, they unconsciously aim for consistency. Fix: blind labels applied by someone outside the study, mapping stored separately.
Subjective readings with no written method. No callout for where to seat the gage, no defined reading point, no instruction on cleaning between parts. Fix: a one-page procedure with a photograph, reviewed by all three operators before the study starts.
Resolution that is too coarse for the tolerance. A common-sense rule is that resolution should be no more than one tenth of the tolerance. Violate that and no amount of operator training rescues the study. Fix: check resolution against tolerance before collecting a single reading.
Operators using different methods. One seats the gage on the first thread, another on the second, and the study measures their habit rather than the process. Fix: train to a single written method and watch the first round unannounced.
Ignoring the interaction term. A study can report an acceptable total GR&R while the operator-by-part interaction is carrying a large share of the reproducibility. You are masking a real problem. Fix: read the interaction row of the ANOVA table, not just the total.
Treating the acceptance bands as universal law. A rigid 10 percent gate on a cosmetic characteristic generates paperwork, not quality. Fix: set tolerance-specific acceptance criteria in writing before the study and apply them consistently afterward.
A few habits that keep studies honest. Record data the same day, on the form, with no later reconstruction from memory. Have the operators initial the sheet at the end of each round. Keep the physical parts until the analysis is signed off, because you will want a re-measure. And schedule the study at a time when the line is running normally, not during the quiet period right after a changeover.
Frequently Asked Questions
How many parts, operators, and trials do I need for a gage R and R study?
The standard crossed design is 10 parts measured by 3 operators with 2 to 3 trials each, giving 60 to 90 total readings. The 10 parts must span the full process operating range and cover the tolerance window, otherwise the part-to-part spread is understated and the gage looks better than it is. Two trials is the practical minimum. Three trials improves the repeatability estimate at the cost of another hour on the floor.
Can I do a gage R and R in Excel?
Yes. Use the average-and-range method with your parts in rows and operator-trial pairs in columns, then compute a part average, a part range, an operator average range, and a part-to-part range. Multiply each average range by its K factor to get EV and AV, then express the combined gage variation as a percentage of total variation. The AIAG MSA worksheets shipped with the MSA Reference Manual are pre-built Excel files and are the safer choice for anything going to an auditor.
How do I interpret the % gage R and R result?
Under 10 percent of study variation is acceptable for production use, 10 to 30 percent is marginal and acceptable only with a documented improvement plan, and above 30 percent is unacceptable until the system is improved and re-studied. Read the number against the number of distinct categories: five or more is preferred, and below three means the system cannot tell good parts from bad. Always report both % contribution and % study variation, since they can disagree.
Why did my gage fail R and R even though it is calibrated?
Calibration proves the instrument reads correctly against a reference at one point in time. It says nothing about resolution, operator technique, or fixturing. A caliper reading to 0.01 on a plus or minus 0.02 tolerance can be perfectly calibrated and completely useless. Other common causes are inconsistent seating between operators, an undocumented measurement procedure, and a fixture that does not return the part to the same place each cycle.
How often should you repeat a gage R and R study?
Treat it as event-triggered rather than calendar-triggered. Re-run it after a new product or process launch, when a gage is replaced or repaired, when operators or shifts change, when the measurement procedure or fixture changes, after a relocation, and when an SPC chart shows a shift you cannot explain. Most quality systems also expect a study on any characteristic used for a customer or PPAP submission.
Should each operator zero or master the gage during the study?
Usually yes, and the way they do it in production. If metrology zeroes the instrument once and locks it, you end up measuring operator technique alone and learn nothing about accuracy against an accepted value. Practitioners on metrology forums broadly argue for letting each operator master the gauge the production way. Be consistent across all three operators and record in the report which method you used.
Conclusion
Start with the one-page measurement procedure, not the spreadsheet. Write down exactly how the feature gets measured, then run the study as designed: ten parts that span the process, three operators including your newest, two trials, randomized order, blind labels, and self-mastered gages. Analyze with ANOVA, read both percentage columns plus the number of distinct categories, and set the acceptance limit against the tolerance before you see the number.
Then act on whichever component is large. High repeatability means the gage needs repair, better resolution, or better fixturing. High reproducibility means the method, the training, or the labeling needs work. Fix it, re-run the study, and keep the signed report in your measurement system file for the next audit.
That is the whole of how to do a gage R&R study that holds up in an audit: a written method, a randomized study, two percentage columns read together, and a decision recorded before the numbers were known.