
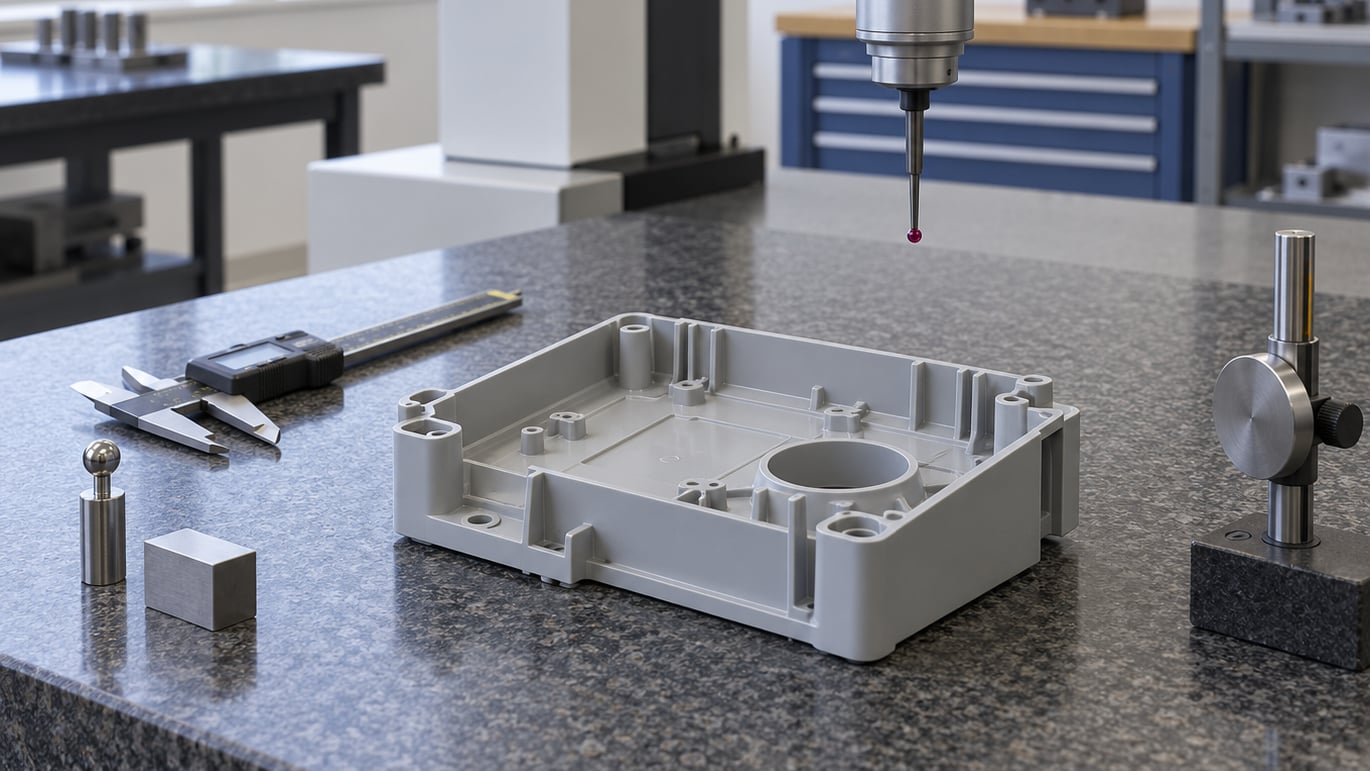
Measurement system analysis explained in plain terms: it is the structured study of the way you measure, aimed at proving your gauges, fixtures, methods and operators produce numbers you can trust. In plastic manufacturing that matters because every capability index, control chart and pass/fail decision you make rests on those numbers. If the measurement is noisy or biased, the process gets blamed for something it never did.
The rest of this guide walks through what MSA covers, the study types you can run, how to read a Gage R&R result, and what to do when the numbers come back poor. It is written for the engineer who has to act on the result, not for someone studying for an exam.
Table of Contents
- What Measurement System Analysis Explained Means
- What Is Measurement System Analysis (MSA) in Plastic Manufacturing?
- Why Do Plastic Manufacturers Need MSA?
- What Are the Main Types of MSA Studies?
- What Is Gage Repeatability and Reproducibility?
- How Is an MSA Study Conducted for Plastic Parts?
- How Do You Interpret GRR and Measurement Error Results?
- What Causes Poor Measurement Systems in Manufacturing?
- How Do You Improve an MSA and Use the Results?
- Frequently Asked Questions
- What is the difference between calibration and measurement system analysis?
- How many parts and readings are required for a Gage R and R study?
- What does a Gage R and R result of less than 10% mean?
- Can MSA be used for attribute inspections such as pass or fail?
- When should a plastic manufacturer repeat an MSA study?
- Does a good MSA prove that the manufacturing process is capable?
- Conclusion
What Measurement System Analysis Explained Means
Put simply, measurement system analysis explained means separating the variation you see in a measurement into two piles: variation that comes from the part being made, and variation that comes from the act of measuring it. Only the first pile tells you anything about your process. The second pile is measurement noise, and it is pure overhead.
Here is a concrete case. You measure the wall thickness of an injection-molded housing with a handheld ultrasonic gauge. The machine reports a standard deviation of 0.008 mm across a batch. Some of that spread is real thickness variation from the molding process. Some is the operator angling the probe slightly differently each time, plus normal-to-abnormal variation in the couplant film between readings.
MSA quantifies the second part. If the gauge contributes 40 percent of the total variation, the process looks worse than it is and your Cpk is understated. If you then chase that phantom spread, you burn weeks on a machine that was already in control.
What Is Measurement System Analysis (MSA) in Plastic Manufacturing?
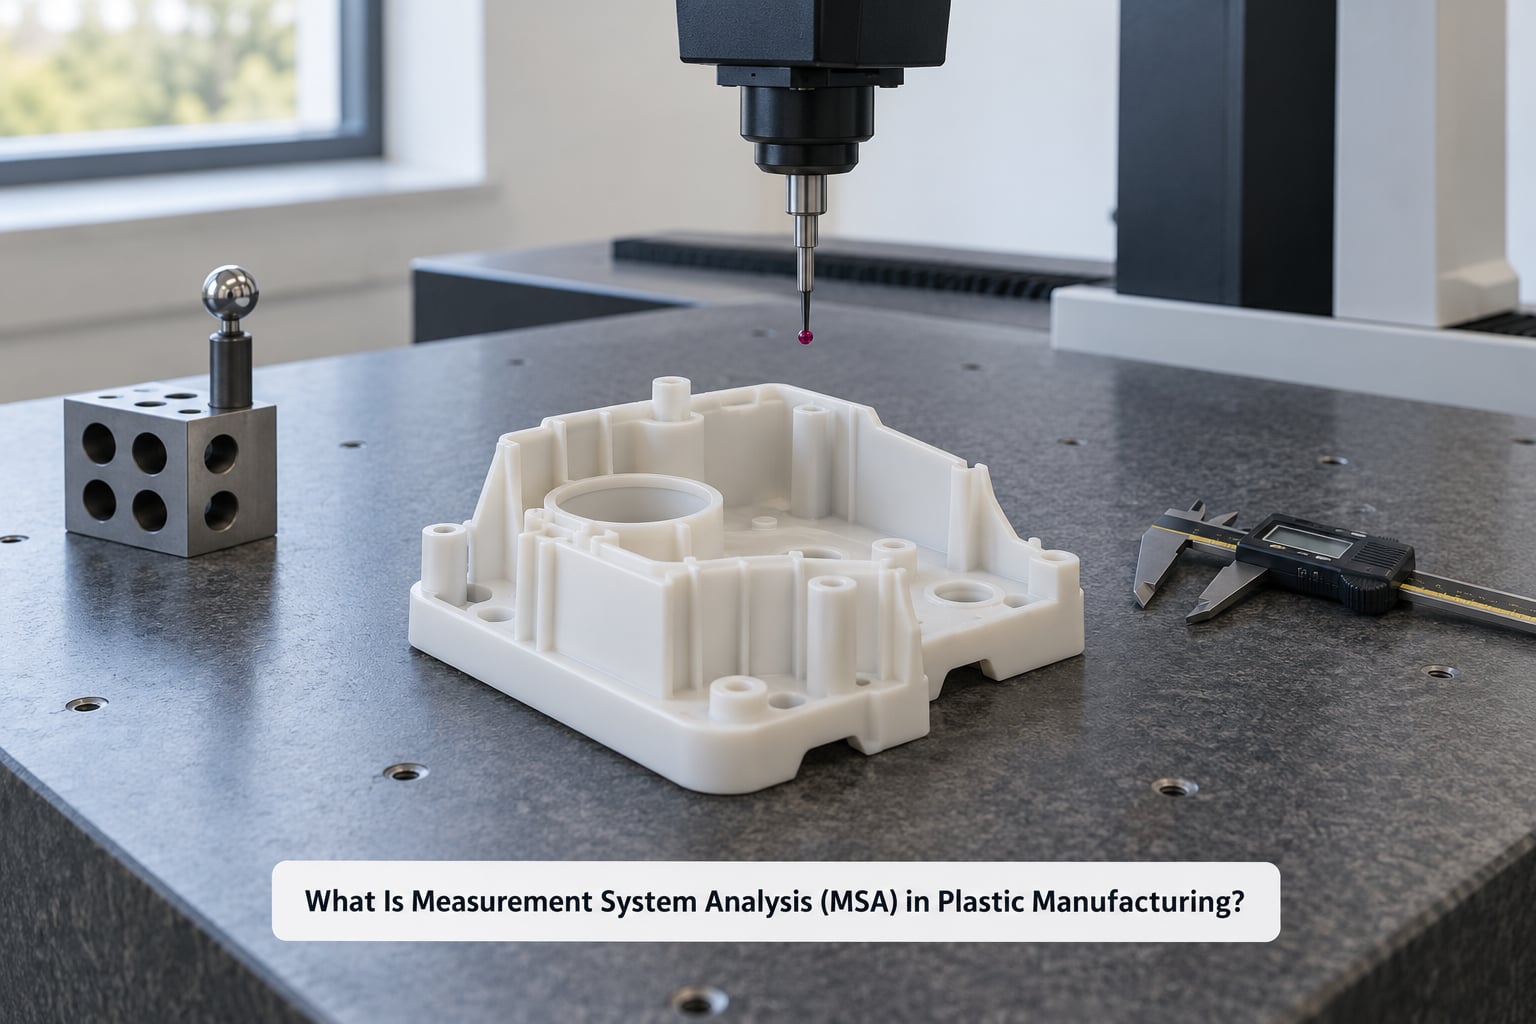
The formal definition: Measurement System Analysis is a set of statistical studies that evaluate a measurement process and quantify the sources of variation in its output, so that decisions about quality, capability and conformance can be made with confidence.
A measurement system is much bigger than the instrument. It includes the people taking readings, the method and work instruction they follow, the fixture that holds the part, the gauge itself, any master or reference standard, the environment, the software settings, and the decision rules for what to do with the result. Change any one of those and you have a different measurement system.
That definition is why a plastic plant that validates a caliper in the metrology lab has not validated the process on the molding floor. Warm plastic, an oily bench, a part that will not sit flat and an operator who was never trained all change what the number means.
The consequence of skipping this work is straightforward. Unreliable measurements generate false alarm signals on control charts, hide real shifts, inflate or understate Cp and Cpk, send root cause analysis after the wrong factor, and drive scrap, rework and customer complaints that no process change ever fixed.
Why Do Plastic Manufacturers Need MSA?
In a molding operation, the reason to study the measurement system is that you cannot improve a process you cannot measure. Most plants run into the same handful of needs, and each one has a specific MSA study attached to it.
- Validating a new gauge before anyone uses it. A new CMM, a new handheld scanner or a redesigned fixture should prove itself on known parts before production data depends on it.
- Reading control charts honestly. Points on a chart mix part-to-part process variation with measurement variation. Without an MSA you cannot tell whether a spike is a machine problem or a gauge problem.
- Supporting capability studies. Cpk built on noisy data is a number without meaning, and it usually changes when someone re-measures the same parts with a better method.
- Reducing inspection errors. Missed defects, scrapped good parts and inconsistent accept/reject calls between shifts all trace back to reproducibility.
- Protecting customer and regulatory commitments. Audit standards such as ISO 9001 require evidence that monitoring and measuring equipment is fit for purpose, and a documented MSA study is that evidence.
- Making acceptance decisions on supplier parts. Sampling rules and incoming inspection plans only hold up if the instrument behind them is repeatable. Our guide to statistical sampling plans explained for molders covers the decision logic on the inspection side.
What Are the Main Types of MSA Studies?
MSA is not one study. It is a family of studies, and you pick the ones that match the risk and the data type of your measurement. Each one answers a narrower question than the others.
| Study | What it tests | Data needed | Where it is used |
|---|---|---|---|
| Calibration | Whether the instrument reads correctly against a traceable standard | Repeated readings of known reference values | Before any MSA study; scheduled on a recurring interval |
| Bias | Whether readings sit consistently above or below the true value | One or more readings per operator against a certified master | New gauges, after repair, and after any suspected drift |
| Linearity | Whether accuracy holds across the whole measurement range | Readings at several known points spanning the range | Gauges used on features with wide tolerance bands |
| Stability | Whether the system drifts over time | Repeated readings of the same master over days or weeks | Any system that can drift: probes, fixturing, temperature sensitive gauges |
| Repeatability | Variation when the same operator re-measures under identical conditions | Repeat readings of the same parts by one appraiser | Diagnosing equipment, method and fixturing limits |
| Reproducibility | Variation when different operators measure the same part | The same parts measured by several appraisers | Shift work, multiple cells, multi-site plants |
| Gage R&R (crossed) | Repeatability and reproducibility together, with part-to-part variation as the benchmark | Parts, appraisers and trials in a structured matrix | The standard study for variable dimensional data |
| Attribute agreement analysis | Whether inspectors agree on pass/fail or on category | Repeated attribute judgements across inspectors | Visual inspection, cosmetic defects, go/no-go gauges |
Variable measurements such as length, diameter and weight need the numeric studies. Attribute judgements such as flash present or surface scratch acceptable need agreement analysis instead. For material properties measured on a bench rather than a molded feature, see our guide on hardness testing for plastics explained, which covers the calibration side of that measurement chain.
What Is Gage Repeatability and Reproducibility?
Gage repeatability and reproducibility is the pair of studies most people mean when they say MSA, because it answers the practical question: how much of my observed variation is the parts themselves, and how much is my measurement process?
| Component | What it represents | Typical source | What fixes it |
|---|---|---|---|
| Equipment variation (EV) | Repeatability: the same appraiser, same setup, short term spread | Gauge resolution, fixturing, part seating, method definition | Better fixture, tighter method, higher-resolution instrument |
| Appraiser variation (AV) | Reproducibility: differences between appraisers measuring the same parts | Technique, interpretation of the drawing, training gaps, shift differences | Retraining, clearer work instruction, defined reference points |
| Interaction | Operators who disagree on some parts but not others | Poorly defined datum or feature interpretation | Sharper measurement definition |
| Part-to-part variation | The real process signal the study measures against | Tool wear, cycle conditions, material lot, machine set | Process work, not measurement work |
| Total Gage R&R | Repeatability plus reproducibility plus their interaction | All of the above combined | Treat as one improvement project, not several |
The key point is what total Gage R&R is being compared against. It is compared against part-to-part variation, not against tolerance, and the two comparison methods give different numbers. Software will often show you both percent of study variation and percent of tolerance. Practitioners on quality forums regularly get stuck on which one their auditor expects, because the modern AIAG manual favors percent of study variation while some customer and legacy specifications still ask for percent of tolerance.
Decide which convention applies before the study starts, document it, and interpret the result against the specification you committed to rather than the one that flatters the result best.
How Is an MSA Study Conducted for Plastic Parts?
A standard variable Gage R&R runs about ten parts, three appraisers and two trials each, which gives sixty readings and enough data to separate part variation from appraiser variation. Treat that as a well-established starting point rather than a law, and adjust only with reasons written down. What I would not do is quietly shrink the study to fit a lunch break and then treat the thinner result as if it carried the same weight.
Selecting the parts
Pick parts that span the real process range, not ten near-identical parts from one cavity. Use parts produced across a normal production window, and if the process is not stable yet, say so in the study notes. Studies with all-similar parts understate variation and make the measurement system look better than it is.
Numbering and presenting parts
Mark each part with a unique identifier that the appraiser can see but that does not reveal the reading order. Randomize the sequence. If part 4 always gets measured in trial one by everyone, any drift in the equipment becomes part-to-part variation instead of noise.
Selecting appraisers
Use the people who will actually take the readings in production, including a second shift if the part is inspected around the clock. One appraiser gives you repeatability only, and you will not know whether the system survives a change of hands.
Controlling equipment, method and conditions
Freeze the instrument, the fixture, the software revision and the work instruction for the duration of the study. Record ambient temperature, because molded polymer parts and many gauges both move with it. A plastic part taken straight off the line and measured hot will not agree with the same part measured an hour later, and that difference belongs in your study, not hidden from it.
Collecting data without contamination
Each appraiser works alone, measures every part twice, and records readings before seeing anyone else’s. There is no discussing a reading that looks odd. Independent readings are the entire basis of the analysis, and a helpful operator comparing notes mid-study destroys it.
Analyzing
Run the crossed Gage R&R in your statistical package, state the variance model you assumed, and read the total Gage R&R percentage, the confidence interval, the number of distinct categories, and the p-value on the interaction term. Interpretation is in the next section.
If the measurement destroys the part, such as a destructive pull test or a cut-sample ash content test, the study becomes nested rather than crossed, because no appraiser can measure the identical specimen twice. Nested studies give you reproducibility cleanly and force you to estimate repeatability from between-specimen differences, which is why the numbers need careful reading.
How Do You Interpret GRR and Measurement Error Results?
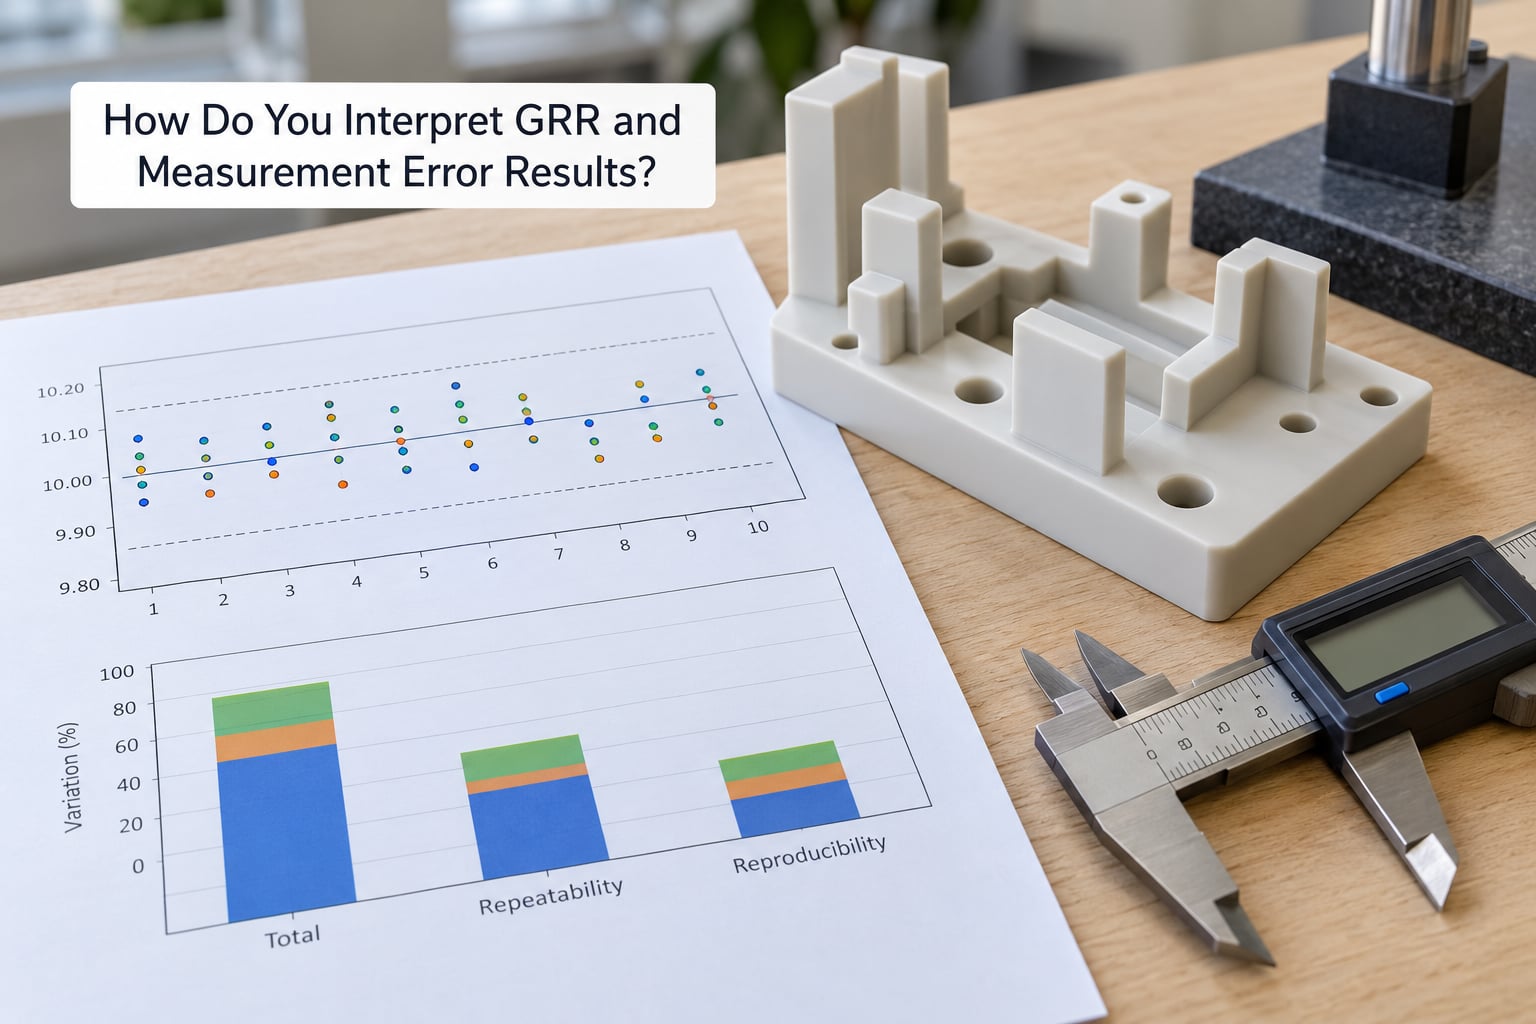
Reading a Gage R&R report is easier when you know which number answers which question. The percent study variation or percent tolerance tells you how much room your measurement system consumes. The number of distinct categories tells you how many buckets the measurement can reliably tell apart. Everything else explains where the variation came from.
| Result | What it means | Common guidance | Where that guidance breaks down |
|---|---|---|---|
| Total Gage R&R under 10% | Measurement variation is a small share of total observed variation | Acceptable for most characteristics, including many critical-to-quality features | Even 10% can matter when the tolerance is tight relative to process spread |
| 10% to 30% | Measurement consumes a noticeable share of the signal | Marginal; acceptable only for non-critical characteristics or with documented mitigation | Customer and regulatory specifications often set tighter limits than this |
| Above 30% | You are mostly measuring the measurement system | Improve the system before trusting capability data or control charts | A few applications with wide tolerances tolerate more than the general rule suggests |
| Number of distinct categories below 5 | The gauge cannot consistently separate parts | Treat as inadequate; work on discrimination as well as precision | Attribute inspections use a different agreement scale entirely |
| Bias outside tolerance | Readings sit consistently off the true value | Investigate setup, calibration and reference standard | Bias alone can be acceptable if consistent and small relative to tolerance |
| Attribute agreement below 80% | Inspectors disagree on pass/fail calls | Improve the defect definition, lighting and training before tightening limits | Percentage agreement can look high while kappa stays poor; read both |
Treat these numbers as starting guidance, not a universal standard. Industry, application and customer specification all shift the bar, and a characteristic that feeds a safety decision deserves a tighter threshold than one used for trend tracking. Some practitioners simply restrict any measurement contributing more than 10 percent and re-study the rest, which is defensible and easy to defend in an audit.
One more trap: a good Gage R&R on a stable process does not prove the process is capable. It proves the numbers are trustworthy. Capability is a separate calculation built on those numbers.
What Causes Poor Measurement Systems in Manufacturing?
When a study fails, the cause is nearly always in this list, and you can usually spot two or three of them by watching one appraiser work.
- Insufficient resolution. The gauge reads in steps too coarse to describe the tolerance. A common rule is that instrument resolution should be at least one tenth of the tolerance band.
- Inconsistent fixturing. A part held differently each time introduces variation the instrument never sees.
- Undefined reference points. If the work instruction says measure from the top, every operator finds a different top.
- Operator technique. Different probe angles, different reading habits, different interpretation of a vague drawing note.
- Temperature variation. Warm parts and thermally sensitive gauges both drift during a shift.
- Worn or dirty equipment. Probe wear, spindle runout, a dusty optical window, a fixture with play in it.
- Software settings. Filtering, alignment routines and rounding can quietly change reported values between runs.
- Measuring non-representative features. Reading one cavity or one location on a multi-cavity tool gives a number the part does not deserve. Profile and extrusion work carries its own inspection subtleties, covered in profile extrusion tolerances explained.
How Do You Improve an MSA and Use the Results?
The corrective action should match what the study actually found. Repeating the study without changing anything produces the same result and a slightly longer report.
Match the fix to the result
High equipment variation points to the fixture, the instrument resolution or the method. High reproducibility with low equipment variation points to training and the written instruction. Part-by-part interaction points to an ambiguous feature or datum definition. Bias that drifts over time points to calibration, thermal conditions or a probe wearing out.
Make the improvement stick
Upgrade the fixture so the part self-locates. Replace or re-qualify the instrument if resolution is the limit. Rewrite the work instruction with photographs, a defined reference point and a stated number of measurement locations. Retrain and observe operators against that instruction, then re-run the study.
Use the results every day afterwards
Document the study, record the chosen variance model and acceptance convention, attach it to the measurement instruction, and reference it in the control plan and the calibration schedule. Set a re-verification interval tied to risk, so a high-use critical characteristic gets looked at more often than a rarely used one.
Once the system passes, capability numbers and control limits start to mean something. Teams that treat the MSA as a gate rather than paperwork get stable capability studies sooner, because the same parts no longer measure differently depending on who held the caliper.
Frequently Asked Questions
What is the difference between calibration and measurement system analysis?
Calibration checks one thing: whether an instrument reads correctly against a known reference value, with traceability to a national standard. Measurement system analysis checks the whole system, including the fixture, method, operator, environment and software, and it separates accuracy problems from precision problems. A gauge can pass calibration and still fail MSA if operators cannot set the part up the same way twice.
How many parts and readings are required for a Gage R and R study?
The widely used crossed design is 10 parts, 3 appraisers and 2 trials, giving 60 readings. That is a strong default, not a requirement. If a study must use fewer parts or appraisers, say so in the report and expect less ability to separate small sources of variation. Whatever the size, the parts must span the real process range.
What does a Gage R and R result of less than 10% mean?
It means total measurement variation, repeatability plus reproducibility, accounts for less than 10 percent of the observed variation in the study. Most characteristics pass that bar comfortably. Watch the comparison basis though: percent of study variation and percent of tolerance are calculated differently and can tell opposite stories on the same data, so confirm which one your specification requires.
Can MSA be used for attribute inspections such as pass or fail?
Yes. Attribute agreement analysis covers pass/fail and category judgements, and it is the right study for visual inspection of flash, sink marks, color or surface finish. Instead of percent variation you get percentage agreement, observed and expected agreement, and a kappa value that corrects for chance agreement. Read both percentages and kappa, since raw agreement can look healthy while kappa stays poor.
When should a plastic manufacturer repeat an MSA study?
Repeat it when the method, gauge, fixture, software or personnel change, when parts from a new tool or material grade arrive, when a calibration shows drift, and on a risk-based schedule for critical characteristics. Also repeat it after a failure, and whenever suspicion shows up on the floor, such as two shifts disagreeing about the same feature. Destructive or one-shot measurements need a nested design when repeated.
Does a good MSA prove that the manufacturing process is capable?
No. A passing MSA proves your data can be trusted; it says nothing about whether the process can meet specification. Capability indices are calculated from those measurements, so a weak measurement system makes the capability number meaningless in either direction. Study the measurement system first, then compute Cp and Cpk, then interpret the capability result on its own terms.
Conclusion
Start with the characteristic that decides whether a part ships or gets scrapped. Run the study that matches its data type, part selection and appraiser selection handled deliberately rather than by whoever is free. Read the result against the tolerance and the process spread together, then improve or re-study the system before anyone quotes a capability number or negotiates with a supplier. Everything downstream of the measurement system depends on that one step being done properly.