
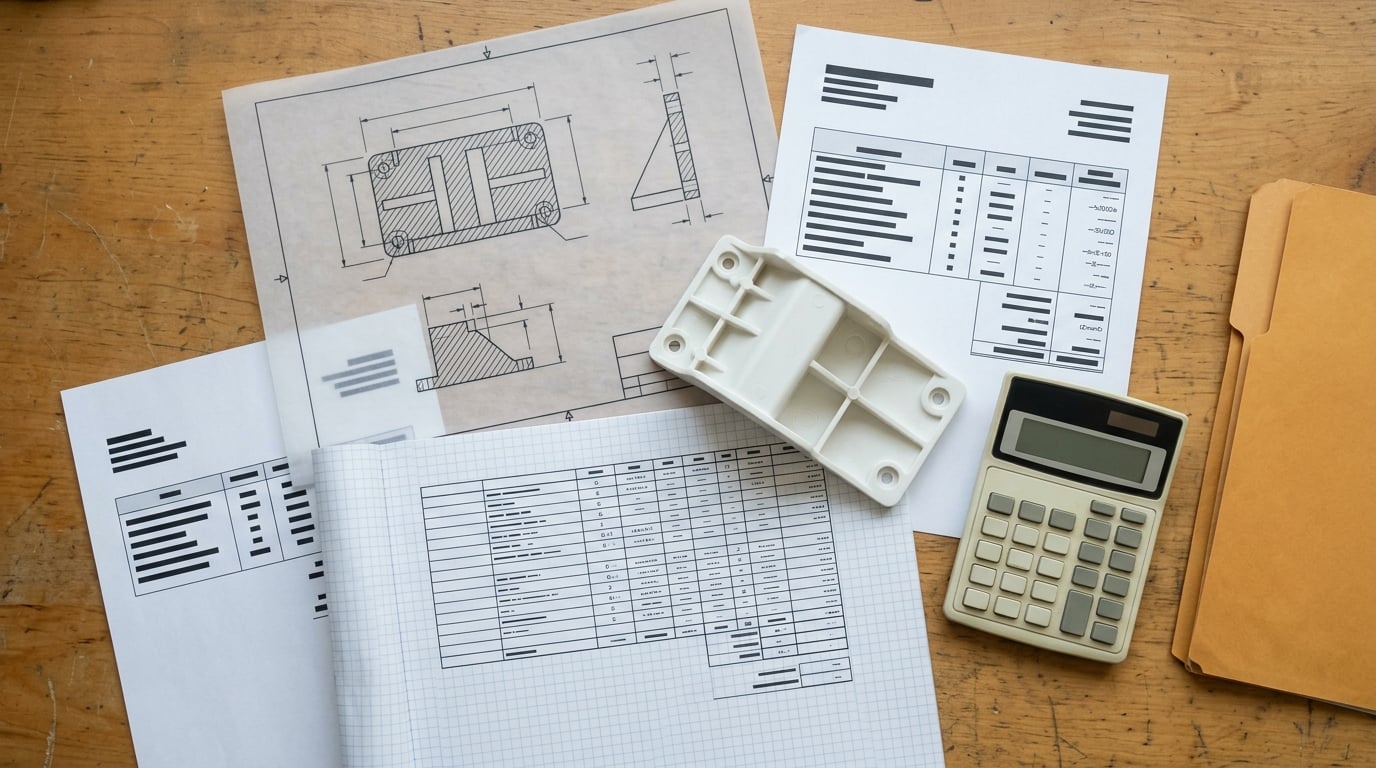
To calculate total cost of ownership for a part, add up every cost the part creates from the first purchase order through final disposal, then divide that total by the number of good pieces you receive over a period you define in advance. The piece price is only one bucket in that sum. Tooling, freight, duties, scrap, rework, downtime and end-of-life handling routinely outweigh it, which is why the cheapest quote on a part is so often not the cheapest part.
Below is the build-up I use with sourcing teams, laid out so you can copy it into a spreadsheet and replace the numbers with your own. Everything is expressed in CU, a cost unit equal to one currency unit in your own accounts, so the structure works no matter where the part is made or what currency the supplier invoices in.
Table of Contents
- What You Need Before You Start
- Step-by-Step: How to Calculate Total Cost of Ownership for a Part
- Frequently Asked Questions
- Should tooling be included when calculating total cost of ownership for a part?
- How should a part supplier amortize tooling costs across production volume?
- What costs belong in part TCO besides the purchase price?
- How do I account for scrap, rework, and warranty costs in a TCO model?
- How many years or parts should I use for a total cost of ownership analysis?
- Can total cost of ownership be calculated for an in-house part?
- How do I compare two suppliers when their quotations use different assumptions?
- Conclusion
What You Need Before You Start
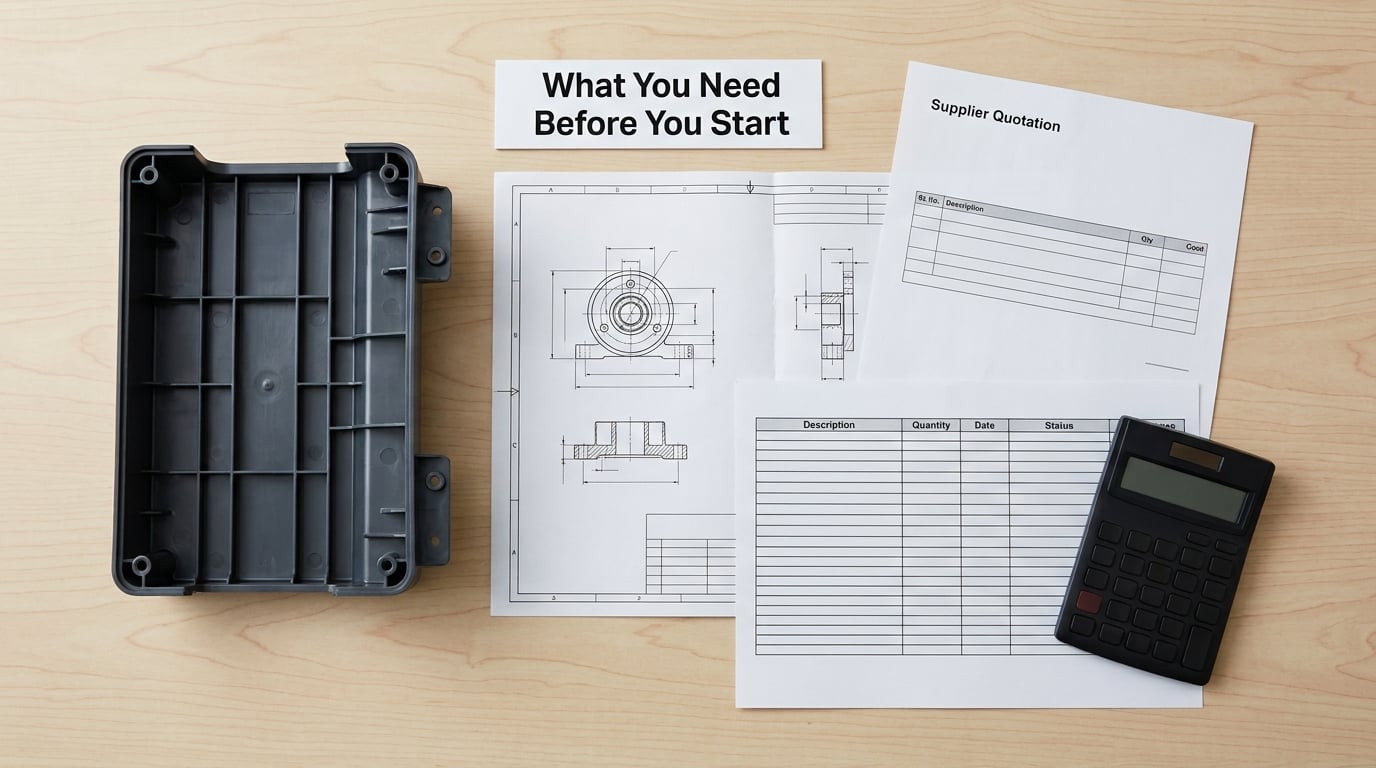
You cannot build a part-level TCO model from memory. Every input below should be a document, a system record, or a stated assumption you can point at later, because the whole model collapses the moment a supplier challenges a number you guessed.
- The released drawing and revision level. TCO is calculated for a specific revision. An unreleased draft means you are pricing a part that does not exist yet.
- Supplier quotations in writing, each with its own volume assumptions, incoterms, packaging terms and validity period stated.
- Volume history. Demand from the ERP or the customer forecast, including the peak year, not just the average year.
- Labor and burden rates for the cells that touch the part: machine and labor rate, changeover time, inspection time.
- Logistics data: freight quotes by lane, duty classification, insurance, and the packaging format parts actually ship in.
- Quality records: scrap rate, rework hours, field return and warranty history for the part or its nearest analogue.
- Lifecycle information: program length, expected design changes, obsolescence risk, and what happens to the tooling and material at the end.
Mark each input as measured or estimated as you enter it. Buyers have told me the fastest way to lose a TCO argument in a supplier meeting is to mix the two and get caught doing it.
Step-by-Step: How to Calculate Total Cost of Ownership for a Part
How to Calculate Total Cost of Ownership for a Part
Add the seven cost buckets, then subtract residual value. The formula is short enough to memorize:
TCO = P + T + L + O + M + S + D − R
| Symbol | Component | What to include for a manufactured part |
|---|---|---|
| P | Purchase price | Piece price or price per batch, plus any per-piece packaging or labeling charge |
| T | Tooling and fixtures | Tool build, gauges, fixtures, first-article and process validation, plus insert and cavity replacement during the program |
| L | Logistics and duties | Freight, insurance, import duty, customs handling, storage and inbound inspection |
| O | Operating cost | Machine time, direct labor, energy, consumables, lubricants, in-house packaging, and internal quality inspection |
| M | Maintenance and repair | Preventive maintenance on the equipment that makes the part, tooling repair, spare inserts, and the labor to do it |
| S | Scrap and rework | Yield loss, rework labor, sort and containment, warranty replacements and field returns |
| D | Downtime and disruption | Changeovers, line stoppages from a part shortage, and lost output priced at contribution margin |
| R | Residual value | Recoverable tooling material, regrind or resale of unused finished goods, deducted at the end |
Ellram and Siferd’s six-category model for total cost of ownership, price, quality, management, supply, service and communication, is a useful sanity check once your buckets are filled. If you have no line that touches quality or supply, the model is too thin.
Define the Part, Volume, and Evaluation Period
Lock the part revision, the annual and peak volume, and the program length before you touch any numbers. A five-year TCO means you total every cost over five years and divide by five years of production; it does not mean five years from the quote date, and it is meaningless compared against a three-year figure from another supplier.
State plainly what the comparison is for: two suppliers, two materials, two processes, or two locations. Each has different inputs, and a model built for a make-or-buy call does not transfer cleanly to a resin substitution study.
Use three volume cases rather than one. A low case around 70% of forecast, a base case at the customer forecast, and a peak case at the highest committed year. Tooling, engineering and end-of-life costs amortize differently at each one, and the winner can change between them.
Calculate One-Time and Recurring Costs
Split the model into what you pay once and what you pay per piece. One-time costs are tooling and fixtures, gauges, validation and first-article runs, line setup, and any engineering change before the part ships. Recurring costs are material, machine and labor time, energy, consumables, in-house inspection, packaging and freight.
Tooling is the line most models get wrong, because it is quoted as a lump sum and then quietly ignored. Amortize it across the good pieces the program actually produces:
Tooling cost per piece = tooling build + inserts and repairs, divided by (annual volume × program years)
| Tooling build | Annual volume | Program years | Good pieces | Tooling cost per piece |
|---|---|---|---|---|
| 180,000 CU | 100,000 | 5 | 500,000 | 0.36 CU |
| 180,000 CU | 50,000 | 5 | 250,000 | 0.72 CU |
| 180,000 CU | 25,000 | 3 | 75,000 | 2.40 CU |
The same tool adds 0.36 CU a piece at high volume and 2.40 CU at low volume, nearly a sevenfold swing from volume alone. A volume-threshold sanity check helps: compare the per-piece tooling add-on against the piece price itself. When it climbs from a rounding error to a real share of the piece price, volume risk is carrying the decision rather than price, and any supplier asking for a volume break is really asking you to take that risk.
Confirm the amortization period in writing. Suppliers routinely assume a two-year spread on a five-year program, and that difference alone can move a comparison by more than half a CU per piece.
Add Quality, Downtime, and Lifecycle Costs
Scrap and rework belong in the model as a yield loss, not as a footnote. If the piece price is C and the scrap rate is s, the cost per good piece rises because you pay for the pieces you throw away:
Cost per good piece = C × s / (1 − s)
| Scrap rate | Add-on at a 3.20 CU piece price | Cost per good piece |
|---|---|---|
| 1% | 0.03 CU | 3.23 CU |
| 2% | 0.06 CU | 3.26 CU |
| 4% | 0.13 CU | 3.33 CU |
| 6% | 0.20 CU | 3.40 CU |
Two extra points on scrap handling. Apply the yield loss to the piece price, not to the total TCO, so you do not inflate freight and tooling twice. And if rework is measurable, price it separately at the cell labor rate, because a part that comes back for correction costs inspection and handling time, not just material.
Downtime is priced at contribution margin per hour, not at selling price, because a stoppage only costs you the margin you would have earned. For a part shortage on a line running at an hourly contribution of 900 CU, a single four-hour stoppage is 3,600 CU. If you have no failure history for a new part, price the risk as a range and mark it estimated rather than picking a number that looks precise.
Finish with the lifecycle tail: engineering changes during the program, storage for parts the forecast did not need, obsolescence and end-of-life obligations, and disposal. Then deduct residual value, which for tooling means the recoverable material or the resale value of unused finished goods. For a discrete part the deduction is usually small, and leaving it out is a fine decision as long as you say so.
Compare Scenarios and Validate the Result
Two parts can land within a few percent of each other and still order differently once volume moves, so normalize the total three ways: cost per good piece, cost per year, and cost per cycle.
Here is a bracket program at 50,000 good pieces per year over five years, 250,000 pieces total. Supplier A quotes 3.20 CU a piece with a cheaper tool; Supplier B quotes 3.85 CU with a better process and a tighter scrap rate.
| Cost bucket | Supplier A | Supplier B |
|---|---|---|
| Purchase price | 800,000 CU | 962,500 CU |
| Tooling, inserts, repairs | 200,000 CU | 120,000 CU |
| Freight, duties, packaging | 137,500 CU | 105,000 CU |
| Scrap and rework | 45,333 CU | 12,722 CU |
| Downtime and changeover | 18,000 CU | 6,000 CU |
| End-of-life, less residual value | 15,000 CU | 15,000 CU |
| Total program TCO | 1,215,833 CU | 1,221,222 CU |
| Cost per good piece | 4.86 CU | 4.88 CU |
| Cost per year | 243,167 CU | 244,244 CU |
| Cost per assembly (two brackets) | 9.73 CU | 9.77 CU |
At base volume the two are a rounding error apart, so comparing the quotes tells you nothing. The decision comes from the sensitivity run. Cut volume to 35,000 good pieces a year, a five-year program of 175,000 pieces, and scale the variable buckets with volume: Supplier A lands at 915,583 CU for the program, or 5.23 CU per good piece, while Supplier B lands at 895,355 CU, or 5.12 CU per good piece. The higher quote wins once volume falls.
That flip is the real output of a part TCO model. Report the volume at which the ranking changes, the scrap rate at which it changes, and whether the crossing point sits above or below the volume your customer has actually committed to. Then run the same three numbers on a design change that raises volume, since a tooling-heavy option often pays back as soon as volume clears a threshold.
Common Mistakes That Inflate or Understate Part TCO
- Comparing quotes with different volume assumptions. One supplier priced 20,000 pieces with a one-year amortization, the other 100,000 over five. Fix: state volume and program length in the same sentence as every number you compare.
- Ignoring tooling entirely. The quote is piece price only, and the tool build appears nowhere. Fix: put tooling in its own bucket with an agreed amortization period.
- Treating downtime as zero. An assumption, not a fact, when the part is on the line. Fix: price it at contribution margin per hour and label the input as estimated.
- Double counting. Scrap cost counted once in the piece price and again in the yield line, or freight added to both landed cost and logistics. Fix: assign each cost one bucket only, and total the buckets to check against total program spend.
- Mixing time horizons. A five-year model next to a three-year one, or a per-year figure next to a per-piece figure. Fix: normalize everything to the same horizon and the same denominator before you compare.
- Presenting estimates as actuals. A scrap rate lifted from a similar part with no history on this one. Fix: tag every input measured or estimated; the label costs nothing and saves the argument.
One last check before you circulate anything: reconcile the bucket totals against what the part actually cost last program. A model that lands far from history without an explanation is a model with a wrong assumption in it, usually a volume figure that never matched the build schedule.
Frequently Asked Questions
Should tooling be included when calculating total cost of ownership for a part?
Yes, for any part with a dedicated tool, gauge or fixture. It is a real cash cost and the second-largest line in most part models after the piece price. Leaving it out is only defensible when the part runs on existing equipment with no dedicated tooling. Put it in its own bucket and amortize it over good pieces produced, not pieces ordered, so the tool cost per piece is comparable across volume scenarios.
How should a part supplier amortize tooling costs across production volume?
Divide the tool build plus any inserts and repairs by the good pieces the program produces, which is annual volume multiplied by program years. Agree the period in writing with the supplier, because a two-year spread on a five-year program is common and changes the per-piece figure substantially. Repeat the calculation at low, base and peak volume, since the amortization term is usually what decides which supplier wins.
What costs belong in part TCO besides the purchase price?
Seven buckets: purchase price, tooling and fixtures, logistics and duties, operating cost, maintenance and repair, scrap and rework, and downtime, less residual value at the end. In-house cell labor, energy, consumables and inspection belong in operating cost. Warranty replacements, obsolescence and disposal belong in the lifecycle tail. A useful secondary check is the Ellram and Siferd six-category model, which adds quality, supply and management costs many part models miss.
How do I account for scrap, rework, and warranty costs in a TCO model?
Model scrap as a yield loss on the piece price using C multiplied by s divided by (1 minus s), so the cost per good piece rises rather than the total. Apply that loss to the piece price only, never to the full TCO, or you inflate tooling and freight twice. Price rework at the cell labor rate including inspection and handling. Book warranty and field returns as a separate line based on returns per shipped piece.
How many years or parts should I use for a total cost of ownership analysis?
Use the length of the program the part actually serves, taken from the build schedule or the customer commitment rather than a round number. A five-year TCO means total costs over five years divided by five years of production, and it cannot be compared with a three-year figure. Run at least three volume cases, around 70 percent of forecast, the forecast itself, and the peak committed year, and report where the ranking changes.
Can total cost of ownership be calculated for an in-house part?
Yes, and in-house parts are often where it pays most, because the piece price is a transfer number rather than a market one. Build the same seven buckets using standard labor and burden rates, machine time, energy, consumables, in-house quality and the allocated share of tooling. The result is a should-cost number you can compare against a supplier quote, which is what makes the make-or-buy conversation concrete.
How do I compare two suppliers when their quotations use different assumptions?
Put both quotes into one worksheet with identical volume, program length, incoterms, packaging and amortization period, then recompute rather than reconciling their formats. Ask each supplier to restate volume breaks, tool amortization period, freight responsibility and scrap history in writing. Where a supplier will not commit to an assumption, price the range and test whether the answer changes inside it. The goal is the assumption that flips the ranking.
Conclusion
Start by building one standardized worksheet and using it for every part, so a bracket decided this quarter is measured the same way as the housing decided last quarter. Enter verified supplier and plant data, tag each input as measured or estimated, and compare alternatives on the same volume, program length and assumptions.
The number to watch is not the total. It is the volume at which the ranking flips, because that is what tells you how much the decision depends on the forecast rather than on the parts themselves.