
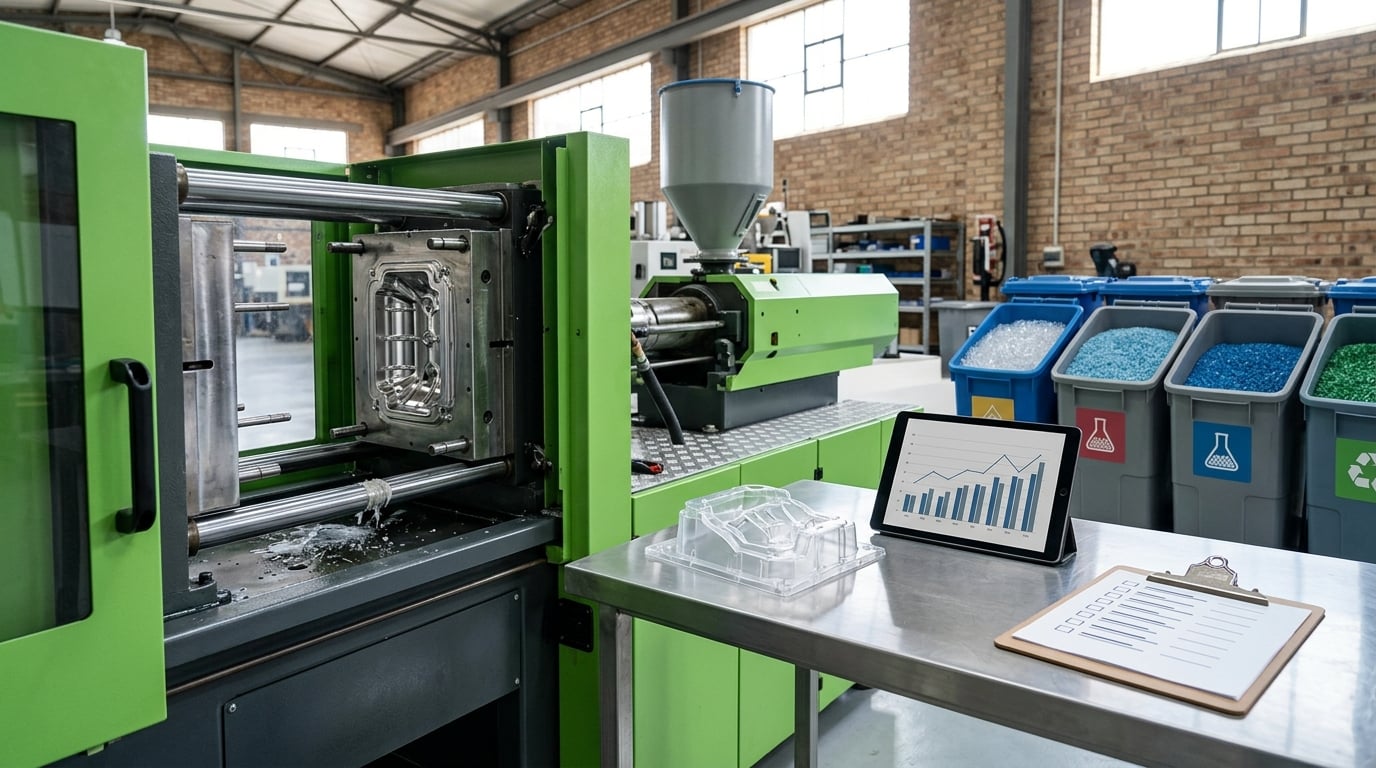
The short answer to how to improve OEE in a molding plant is unglamorous: measure one press honestly, find the largest single loss on it, and fix that loss before touching anything else. OEE is Availability multiplied by Performance multiplied by Quality, and because the three factors multiply, the weakest one caps everything else. A plant running 90% availability and 95% quality still only reaches 86% OEE if the press is creeping along at 90% of its ideal cycle.
What makes molding different from most OEE examples written about stamping or machining is that you have three constraint sets pulling on each other: the press, the mold, and the material. The press has a clamp force and a screw recovery limit, the mold has a cavity count and a cooling time, and the resin has a drying window and a regrind ratio. Working all three is what moves the number, not chasing cycle time on the machine screen.
The three factors that go into OEE, defined once so the rest of this guide is easy to follow:
- Availability is run time divided by planned production time. It answers whether the press was free to mold at all.
- Performance is ideal cycle time multiplied by total count, divided by run time. It answers how fast the press ran against how fast it could run.
- Quality is good count divided by total count. It answers how many of the molded parts were saleable.
Here is the eight-step sequence, in the order that works.
1. Establish a trustworthy baseline on one press. Fix the definition of planned production time and write it down, or your number will not survive the first argument with production.
2. Log every stoppage with a reason code. Timestamp, machine, mold, reason, duration, owner.
3. Build a Pareto of your top losses. Rank by minutes lost per week, not by how annoying they feel.
4. Attack the biggest availability loss first. In most molding plants that is changeover, not breakdowns.
5. Separate speed loss from cycle-time loss. A press cycling at 80% of ideal is a different problem from a press that stops for four minutes twice an hour.
6. Split scrap into startup rejects and in-process rejects. They have different causes and opposite cures.
7. Run one controlled change at a time. Verify it with a time study, not an impression at the end of the shift.
8. Standardize the fix and review the trend weekly. Track daily, weekly, and monthly OEE separately.
Table of Contents
- What You Need Before You Start
- Step-by-Step: How to Improve OEE in a Molding Plant
- 1. Establish a reliable OEE baseline
- 2. Classify and prioritize downtime losses
- 3. Separate speed loss from cycle-time loss
- 4. Reduce defects, scrap, and rework
- 5. Improve setup and changeover time
- 6. Build a daily loss-control system to improve OEE in a molding plant
- 7. Run root-cause improvements without harming quality
- 8. Standardize, verify, and sustain the gains
- Common Mistakes That Break OEE Programs
- Tips for Squeezing Out More Availability
- Frequently Asked Questions
- Conclusion
What You Need Before You Start
You need a shift calendar, a reason-code list, a piece counter that counts parts rather than shots, and someone with authority to change a process setting. Everything else is a nice-to-have. Most plants that struggle with OEE are not short on software, they are short on a shared definition of what counts as a good part and what counts as planned downtime.
Gather this data for one machine, one shift, for at least two weeks:
- Planned production time in minutes, with scheduled breaks, planned maintenance windows, and training time explicitly classified as planned or excluded. This is the denominator for Availability, so it is the most argued number in the plant.
- Run time to the minute, taken from the machine controller or a validated hand log, not from memory at shift end.
- Shot count and cavity count per tool, so you convert shots into parts. A four-cavity tool running 24-second cycles makes 600 parts an hour; the same press with a single-cavity tool makes 150.
- Good count and total count, with total count meaning every part the tool produced, including scrap and rework. If you only count good parts, your Quality factor is always 100% and your OEE is fiction.
- Scrap split into startup and in-process, with weight if you can weigh it. Startup is the first shots while barrel and mold temperatures stabilize after a changeover; in-process is everything after the process has settled.
- Changeover timestamps for every tool change: first activity to first good part.
- Process conditions during the shift: melt temperature by zone, barrel and mold setpoints, back pressure, hold pressure and time, screw recovery time against the cycle, cushion, and any hot runner setpoints.
- Downtime reason codes agreed with operators, maintenance, and quality before the log starts, not invented afterwards.
For the measurement itself, you have three realistic options. Manual paper or whiteboards at the machine are free and teach the team a shared language, but transcription error and end-of-shift memory make the data soft. PLC or machine-controller collection is accurate on cycle counts and run state, and needs someone to assign the reason codes. Sensor-based IIoT collection is the most complete and usually reports on a shift after the fact rather than in real time, which matters more for weekly review than for the shift itself.
Step-by-Step: How to Improve OEE in a Molding Plant
1. Establish a reliable OEE baseline
OEE is calculated on four nested time boundaries, and getting the order right is most of the work. Opening time is the full shift including planned pauses. Planned production time is what is left after you remove planned stops. Run time is planned production time minus unplanned downtime. Effective or productive time is run time minus the losses inside running.
| Time boundary | Definition | Worked shift (4-cavity tool, 24-second ideal cycle) |
|---|---|---|
| Opening time | Full shift | 480 min |
| Planned production time | Opening time minus planned stops (30 min break) | 450 min |
| Run time | Planned production time minus unplanned downtime (90 min) | 360 min |
| Productive time | Run time minus micro-stops and slow running | 322 min (38 min lost to hesitation, short cycles and micro-stops) |
| Effective time | Productive time minus time producing scrap or rework | 299 min equivalent (23 min lost at 48 g per part and four cavities) |
Here is how the three factors come out for that shift. The machine was free to run for 360 of 450 planned minutes, so Availability is 0.800. It produced 815 shots in 21,600 seconds of run time, an average cycle of 26.5 seconds against a 24-second ideal, so Performance is 0.905. It produced 3,260 parts (815 shots multiplied by 4 cavities) of which 2,990 were good, so Quality is 0.917.
OEE is 0.800 multiplied by 0.905 multiplied by 0.917, which is 0.665, or 66.5%. Watch the decimal habit here. Three factors at 90% is not 90%, it is 0.729. If your plant reports 85% from three 95% factors, someone is adding instead of multiplying. The 270 rejected parts weigh about 13 kg of scrap for this shift, which is a Quality problem the press cannot fix by cycling faster.
Steps 2 through 8 assume you can defend this baseline. In practice, most plants discover their real OEE sits 10 to 15 points below what they believed, and that gap is where the first improvement opportunity lives.
2. Classify and prioritize downtime losses
Use a fixed reason-code list. For a molding line it usually needs: injection or filling fault, mold change, material feed or dryer fault, purge or warmup, robot, conveyor or takeout failure, sensor fault, operator unavailable, quality hold, utility failure, and press breakdown. Resist the urge to keep refining the list. Fifteen codes used consistently beat forty codes used creatively.
Then rank losses on three axes rather than one: total minutes per week, whether the event can repeat at any time, and whether it carries a safety or quality risk. A twelve-minute sensor fault that happens on every tool change beats a two-hour breakdown that happens twice a quarter.
| The six big losses | Where it hits OEE | What it looks like on a molding line | Primary lever |
|---|---|---|---|
| Setup and adjustment | Availability | Mold change, purge, warmup, first shots | SMED, staging, checklist |
| Breakdowns and minor stops | Availability | Press faults, heater band, robot or sensor faults | PM on observed failure modes, MTTR |
| Idling and reduced speed | Performance | Hesitation, screw recovery overrun, long set hold times | Process window review |
| Micro-stoppages | Performance | Short cycles, takeout waiting, sensor hunting | Machine-side observation, reason codes |
| Startup rejects | Quality | Short shots and weight drift on the first shots after a tool change | Temperature recovery check before release |
| Process defects | Quality | Flash, weld lines, sink marks, warpage, contamination, dimensional drift | Defect Pareto, mold and material checks, SPC |
Two things make this step pay off on a molding floor. First, track OEE per mold, not only per press. A press that averages 70% may be carrying a 25-tool mix, and the tool that is dragging the line is obvious once you rank tools by OEE contribution. Second, connect long downtime back to MTTR. In-process rejects on a molding line are frequently a machine-health symptom, a failing heater band or a worn mold component, and the same condition shows up first as downtime and later as scrap.
3. Separate speed loss from cycle-time loss
Performance loss is not one thing, and the two halves need different fixes. Reduced speed is a press that is running but slowly: hesitation at mold close, a screw that has not finished recovering plasticizing before the next shot, a cushion set too small to hold pressure, or hold time set longer than the part needs. Short cycles come from idling and minor stops, a sensor hunting, or a takeout robot waiting for a tray.
Start from the actual cycle against the ideal cycle on the machine screen, then check screw recovery time. If recovery is eating 3 seconds of a 24-second cycle, the fix is a barrel temperature, back pressure, or screw-speed change, not operator pressure. The molded result is the verification: measure weight and critical dimensions on the first and last shot of a run and compare them, because a cycle shortened into a short shot raises Performance and destroys Quality at the same time. For most plants, how to improve OEE in a molding plant means closing this performance gap with verified settings rather than with pressure on the operator.
4. Reduce defects, scrap, and rework
Split your rejects into startup and in-process before you do anything else, because the cures run in opposite directions. Startup rejects are the first shots after a changeover while the barrel, hot runner, and mold reach temperature. The cure there is process control: verify the melt temperature has actually recovered before declaring the tool ready, tighten the mold temperature controller, and confirm the purging volume and drying time for the resin you just loaded. In-process rejects are defects appearing on a stable tool: short shots, flash, weld lines, sink marks, warpage, flow marks, contamination, or dimensional drift. The cure there is usually the mold, the material, or a drifted setting.
Build a defect Pareto by defect type and tool, then verify the process window on the losing tools before changing anything. On any specific defect, check material drying and feed, mold condition and venting, and then the process settings. Layered process audits, standard work, and SPC on the critical dimensions catch drift long before the scrap pile shows it. Regrind ratio and giveaway are molding-specific quality terms that never appear in a generic OEE list and are worth tracking in the same pass.
5. Improve setup and changeover time
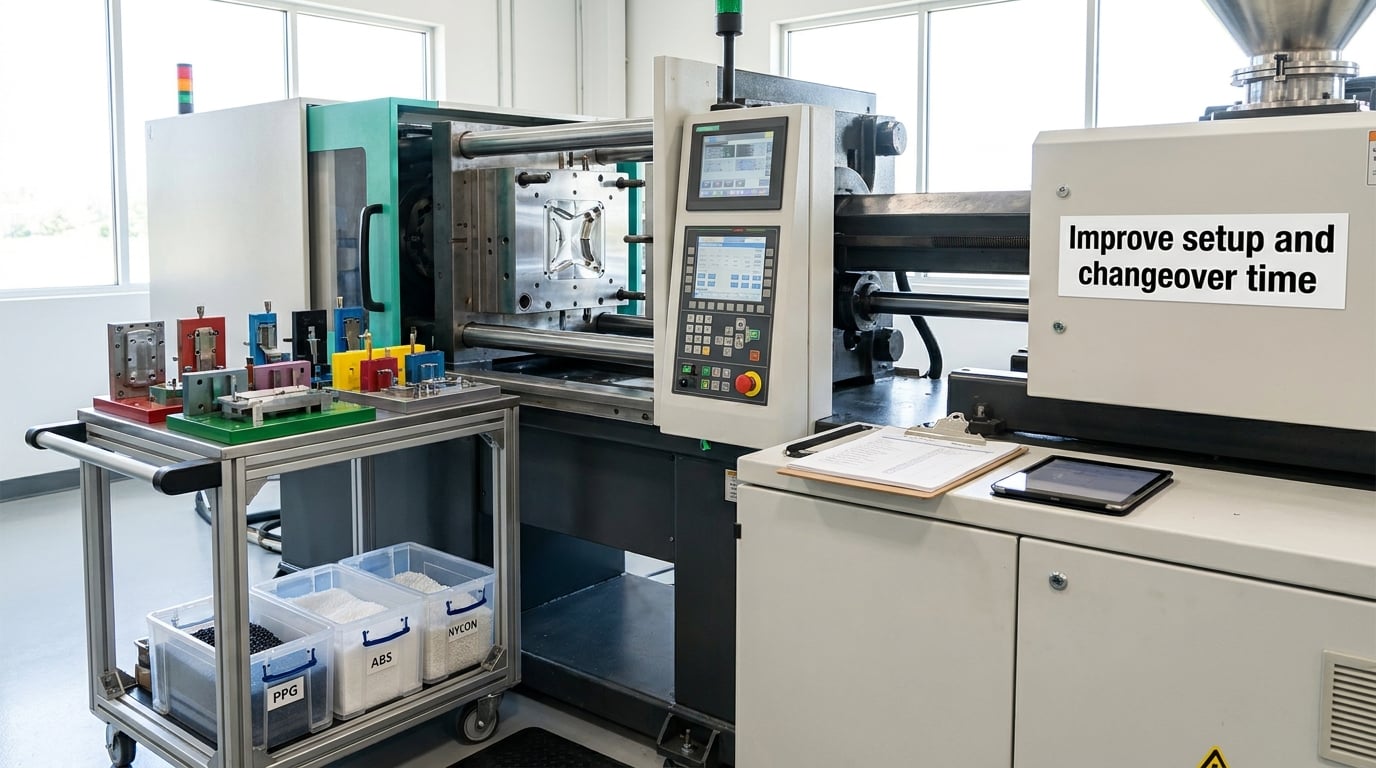
Planned changeovers should sit outside planned production time, and a molding plant that gets that right can show a very good OEE while still bleeding hours a week. So check the honesty of the boundary before celebrating. Changeovers that happen inside the production window, or that are quietly reclassified as planned so the numbers look better, are the most common reason a molding plant’s OEE and its actual output disagree.
Run the changeover as a time study and separate four phases: last good part out, tooling and material staging, mechanical work, and restart to first stable good part. Most plants lose most of their time in the first and last phases, not the mechanical middle. SMED, originally Single-Minute Exchange of Die, is the standard approach: stage tooling, material, and documentation outside the machine, preheat molds and inserts before opening, standardize the work, verify sensors and safety devices with the machine idle, and document every repeat step on a checklist. Published industry results for well-executed SMED work land around a 40 to 60% cut in changeover time.
This is the highest-value lever most molding plants have, and for plenty of high-mix lines it is where how to improve OEE in a molding plant is won or lost. One academic study of molding operations found prolonged setup accounted for 57.6% of losses, ahead of press downtime, and vendor case data on plastics lines points the same way: changeover, not breakdowns, is the dominant availability drain in high-mix molding.
6. Build a daily loss-control system to improve OEE in a molding plant
Put the OEE tree on a board at the machine: Availability at the top, then the reason-code minutes for that shift, then the top three losses with an owner and a target response next to each. A significant stoppage over a threshold you set, for example five minutes or a named set of fault codes, should trigger a text or a call to the named owner, not a note on a clipboard read next week.
Keep containment and root cause separate in writing. Containment is what the shift lead does in the next ten minutes. Root cause is the work item that goes into the improvement backlog with a due date. At handoff, the outgoing lead records open items, any process setting that was changed, and the specific fault the next shift should watch for.
7. Run root-cause improvements without harming quality
Work the chronic losses, not the loudest one. Use 5 Whys to get past the first answer, a fishbone to separate machine, mold, material, method, people, and measurement, and a time study when the claim is about how long something takes. Test one change at a time on one tool with the process window verified before and after.
Put guardrails on every trial: a part weight window, the critical dimensions, a defect checklist, and a screw recovery and cushion check. A change that adds 0.5 seconds to the cycle and saves 2% in flash has cost you real OEE even though the defect rate looks better on the chart. Nobody is ever fired for a controlled trial that was documented, and a trial that quietly ships bad parts for a week is the fastest way to lose the operators’ trust in the whole program.
8. Standardize, verify, and sustain the gains
Turn the fixes that worked into layered process audits, work instructions, preventive-maintenance standards using the actual failure modes you recorded, and training for the shifts that were not present during the trial. The gain is not real until a different setter can repeat it on a different shift.
Review daily, weekly, and monthly OEE separately. Daily numbers move with the product mix, so a day of low OEE on a complicated tool is not a failure. Monthly numbers are what tell you whether the program worked. Keep the evidence that good-part output and on-time delivery held steady alongside the OEE line, and if demand is your real constraint rather than equipment hours, look at TEEP, which measures against the full calendar instead of scheduled time.
Common Mistakes That Break OEE Programs
Manipulating the ideal cycle time. If ideal cycle is set to whatever the press was doing last month, Performance is rigged to look fine. Fix: set ideal cycle from the design cycle at rated shot weight, with a documented allowance for the cycle, and never revise it to improve a trend.
Counting only major stoppages. A five-minute threshold hides the micro-stops that consume a quarter of a molding shift. Fix: set the capture threshold low, and review micro-stops separately as their own loss category.
Combining unverified scrap and rework. If total count comes from an estimate rather than the counter, Quality is a guess. Fix: count every molded part, then reconcile the reject weight against the counter.
Blaming operators. OEE is a machine and process number. If operators think it measures them personally they will game it, usually by not reporting the fault. Fix: measure at machine, cell, and plant level, and evaluate people on safety, quality, standard work, and learning.
Changing several process settings at once. You lose the cause and you may be holding an unrepeatable process. Fix: one change, one window verification, one result.
Setting a plant-wide target without a line baseline. A hydraulic 300-ton press running a complex multi-cavity tool and an all-electric press running a simple two-second cycle are not comparable. Fix: benchmark comparable products, machine types, automation levels, and mix complexity, and publish the comparison criteria with the number.
Celebrating OEE without a safety and quality check. The 85% figure that gets repeated everywhere is a discrete-manufacturing target, not a molding target, and chasing it by shortening cycles is how flash and short shots get created. Fix: hold OEE gains only when part weight, dimensions, and defect rate are stable.
Tips for Squeezing Out More Availability
Post the top three losses for the current week where operators can see them. People fix what is on the wall far more reliably than what is in a monthly report.
Watch two full cycles at the machine, hands off, before judging a press. Hesitation and sensor hunting are obvious in real time and invisible in data.
Keep trial and purge material organized and labelled by tool and resin. Searching for material is a real availability loss that nobody codes because nobody thinks of it as downtime.
Keep a check sheet for faults that repeat, with the reason, the action taken, and the outcome. A recurring fault is a process problem until proven otherwise.
Review OEE trends with maintenance, production, engineering, and quality in the same meeting, once a week. The mold engineer and the quality engineer see different causes for the same number, and neither of them sees all of them alone.
Frequently Asked Questions
How Do You Improve OEE Without Lowering Quality?
Yes, but never by shortening the cycle first. Raise availability through changeover reduction, planned maintenance, and repeat-fault elimination, then raise performance only after verifying the process window on the affected tools. Track part weight, critical dimensions, defect counts, regrind ratio, and customer complaints next to the OEE number. If OEE climbs while weight drifts or flash rises, you moved the loss rather than removing it.
What Is a Good OEE for an Injection Molding Plant?
There is no universal number, because OEE is only meaningful against a comparable set of products, machines, and automation levels. A high-mix plant running complex multi-cavity tools on older hydraulic presses will never reach the OEE of a high-volume plant on a fast electric press with a simple tool. Benchmark against your own best-performing comparable line, set a baseline, then set a phased target above it. The widely quoted 85% world-class figure is a discrete-manufacturing benchmark, not a molding target.
Should OEE Exclude Planned Downtime?
Yes, scheduled breaks, planned maintenance windows, and planned changeovers belong outside planned production time, because they are not production loss. The rule that matters is consistency: the same classification must be applied on every shift and every line, and it must not be used to hide a changeover that is really an availability loss. Write the policy down, get production, maintenance, and quality to agree it, and review it when schedules change.
How Can a Molding Plant Reduce Scrap?
Classify the defect first, then verify the machine and material in a fixed order: confirm drying time and temperature, feed, and regrind ratio, check mold condition, venting, and alignment, verify the process window, then review settings. Build a Pareto by defect type and tool so you fix the top cause instead of adjusting pressures hoping something improves. SPC on critical dimensions and layered process audits catch the drift that creates in-process rejects long before a customer complaint does.
Is OEE a Good KPI for Individual Injection Molding Operators?
No, not on its own. Quality, equipment condition, material delivery, maintenance response, and the production schedule all affect the number, and an operator cannot control most of them. Use OEE at machine, cell, and plant level, and evaluate people on safety, quality, standard work, problem-solving, and training participation. Where operators do engage with the number, show them the losses they personally removed, which is usually enough to keep the reporting honest.
Conclusion
Start with one press, one shift definition, and one honest number. Find the largest unplanned loss on that machine, name an owner for it, and run one measured improvement cycle with quality and safety guardrails in place. Sustainable gains come from removing losses, not from asking the crew to run a 24-second cycle in 20 seconds.
Once the baseline is trusted, the rest is repetition: Pareto your losses, fix the biggest one, standardize it, and check the trend. A plant that works through how to improve OEE in a molding plant five points a year with evidence behind each step will beat a plant chasing 85% and blaming operators for the result.