

If you have ever sat in a production review and heard someone say “our Cpk is fine,” the odds are good that the Ppk in the same report told a different story. The two numbers measure almost the same thing using almost the same formula, and the only thing that separates them is which standard deviation goes in the denominator. Getting that choice right is the difference between knowing your process can hold a tolerance and knowing whether it actually did.
This guide is written for plant managers, operations directors and quality leads who receive capability numbers in meetings but were never trained in statistical process control. No Six Sigma vocabulary required. Every term gets defined the first time it shows up, and every rule comes with the plain-language version underneath it.
Short version of cpk vs ppk what plant managers need to know: Cpk asks how well your process could perform if the mean stayed put from now on. Ppk asks how your process has actually performed across every part you shipped, drift and tool wear and shift changes included. Cpk is the better number. Ppk is the more honest one. A plant that reports only Cpk is describing a process it wishes it had.
Table of Contents
- The 60-second answer
- CPK vs PPK: What Plant Managers Need to Know at a Glance
- What Is Cpk and What Does It Measure?
- What Is Ppk and What Does It Measure?
- What Is the Difference Between Cpk and Ppk?
- Why Cpk and Ppk can disagree on the same data
- How Do You Calculate Cpk and Ppk?
- The 1991 ASQC/AIAG rule worth remembering
- Worked example you can check by hand
- How Do You Interpret Cpk and Ppk Values?
- When Should Plant Managers Use Cpk Instead of Ppk?
- When Should Plant Managers Use Ppk Instead of Cpk?
- What Do Cpk and Ppk Values Mean for Control Decisions?
- Diagnostic matrix: what the number pattern means
- Which number goes in which meeting
- How Can You Prevent Misleading Capability Results?
- Which Should You Choose?
- Frequently Asked Questions
- Which is better, Cpk or Ppk?
- Can Cpk and Ppk be greater than 1.0?
- Why should Cpk and Ppk not be compared across different products?
- What sample size is needed for a valid capability study?
- Does a Cpk of 1.33 prove a process is in statistical control?
- How should a plant manager investigate a large gap between Cpk and Ppk?
- Conclusion: Start by Checking Process Stability
The 60-second answer
1. Cpk divides the distance to your nearest spec limit by three times the within-subgroup standard deviation. It describes potential.
2. Ppk divides the same distance by three times the overall standard deviation of every individual reading. It describes what happened.
3. If the two numbers are close, the process is stable and you are looking at real capability. If Cpk is much higher than Ppk, something is moving the mean between subgroups, and that movement is where your scrap and your customer complaints live.
4. A capability number without a preceding control chart is a number without meaning. Stability first, always.
CPK vs PPK: What Plant Managers Need to Know at a Glance
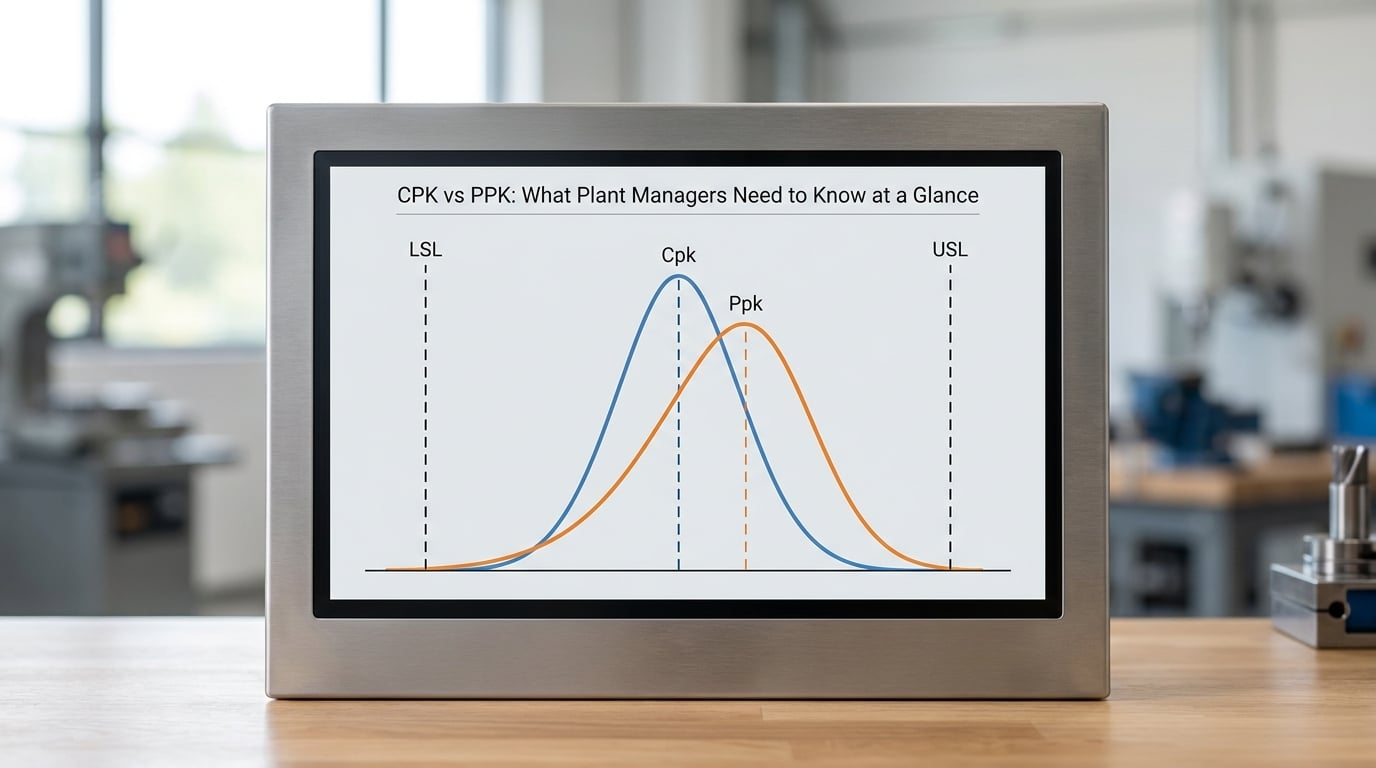
The table below is the whole comparison. Cpk measures what the process is capable of holding on a good day; Ppk measures what it actually held across the period you studied. Everything else in this article is a consequence of that one difference.
| Criterion | Cpk | Ppk |
|---|---|---|
| Purpose | Potential capability: the best the process could do with its own short-term variation | Overall performance: what the process actually delivered over the study period |
| Variation considered | Within-subgroup only, called sigma within or estimated sigma | All observed variation, called sigma overall or calculated sigma |
| Subgroup use | Requires rational subgroups, typically 4 to 10 consecutive parts from one machine, one shift, one material lot | Ignores subgroup boundaries and treats every reading as one long stream |
| Best operational stage | New product launch, ramp-up, post-improvement verification, process design review | Routine production monitoring, supplier audits, customer PPAP, short or mixed runs |
| Typical value vs Ppk | Equal to or higher than Ppk | Equal to or lower than Cpk |
| What a high value proves | Short-term precision and centering are good, assuming subgroups are rational | The process as a whole, including drift, has been consistently inside the specification |
| What it does not prove | That the process stayed centred between subgroups, so it cannot rule out drift | Which machine, shift or material is responsible, so it cannot by itself tell you where to act |
| Main limitation | Can flatter an unstable process when subgroups are too small or wrongly chosen | Blends every cause of variation into one number, which hides the fixable one |
| Recommended action | Pair with a control chart and Ppk before making any release or capability claim | Stratify by machine, shift, operator or material to find which subgroup is driving the loss |
What Is Cpk and What Does It Measure?
Cpk measures how much room your process has between its average output and the nearest specification limit, after accounting for the variation it shows from one reading to the next. It is a statement about potential, which means it assumes the process stays where it is.
Written out, Cpk is the smaller of two distances. You take the gap between the process mean and the upper specification limit (USL), and the gap between the lower specification limit (LSL) and the mean, then divide whichever is smaller by three times the within-subgroup standard deviation.
Sigma within is estimated from rational subgroups. If you pull five consecutive parts every hour from the same machine running the same material lot, the spread inside each group of five is mostly the machine breathing. Average that within-group spread across all your subgroups and you get an estimate of the variation your process shows hour to hour.
The reason for dividing by three sigma is a simple convention. Under a normal distribution, roughly 99.73 percent of measurements fall within plus or minus three standard deviations of the mean. So a Cpk of 1.33 means the whole six-sigma spread of the process just fits inside the tolerance window, and only the nearest limit is doing the constraining.
Cpk also accounts for centering. Cp ignores where the mean sits and measures only the width of the tolerance compared with the width of the process. Cpk adds the position of the mean into the math, so a process that is technically wide enough but sitting half a tolerance off center gets a Cpk well below its Cp.
That is the entire idea behind Cpk: it asks how much room you have, and it will not let you forget where you are standing in the room.
What Is Ppk and What Does It Measure?
Ppk measures the same margin between the process mean and the nearest specification limit, but it divides by three times the overall standard deviation of every individual reading you collected. Nothing is grouped. Nothing is separated. One standard deviation, calculated across the whole dataset.
Because the overall standard deviation is always equal to or larger than the within-subgroup one, Ppk is always equal to or smaller than Cpk for the same dataset. The gap between the two is not a rounding error. It is the amount of variation that appears when you compare one hour to the next.
That extra variation comes from somewhere specific. Tool wear over a shift. A material lot that runs slightly harder. A second shift running a slightly different setpoint. A machine that needed an adjustment halfway through the week. Ppk folds all of it into the denominator, which means Ppk answers a question Cpk cannot: over the full study period, did the process hold this tolerance?
The same convention of three sigma applies, so the interpretation is identical in structure. A Ppk of 1.33 means the total six-sigma spread of your process, drift included, just fits inside the tolerance window.
Ppk is the number customers usually ask for in a PPAP submission, and for good reason. It describes shipped product rather than machine potential. Practitioners report that argument often enough that it is worth preparing for before a customer quality engineer asks.
What Is the Difference Between Cpk and Ppk?
The difference between Cpk and Ppk is the standard deviation in the denominator. Cpk divides by the within-subgroup sigma, which only sees variation between parts measured close together. Ppk divides by the overall sigma of all individual readings, which also sees variation between subgroups. Same mean, same limits, same factor of three, different denominator.
Operationally the difference is the difference between potential and performance. A plant manager should read Cpk as a statement about equipment and a statement about Ppk as a statement about everything else, including the people running it.
Why Cpk and Ppk can disagree on the same data
Consider a shaft measured at 10.00 millimetres with a tolerance of plus or minus 0.05. The process runs thirty subgroups of five consecutive parts, and the mean sits almost dead centre at 10.002.
Inside each subgroup of five, the parts vary tightly, giving a within-subgroup standard deviation of 0.006. That produces a Cpk of roughly 0.005 divided by 0.018, which is about 1.39. Excellent by any standard.
Now the overall standard deviation across all 150 readings comes out at 0.015, because the mean of one subgroup is 10.01 and the mean of the next is 9.99. The overall Ppk is therefore 0.005 divided by 0.045, which is about 1.11. Same parts, same machine, same tolerance, 2,000 parts per million predicted out of spec instead of 45.
Nothing went wrong on the machine. The mean simply wandered by two hundredths of a millimetre across the run. That wander is the whole difference between the two numbers, and it is the part that generates scrap, sorting labor and customer returns.
This is also why subgroup size matters so much. Sample five parts one after another and you capture a snapshot, so sigma within looks small and Cpk looks generous. Spread those same five parts across a shift and you capture the drift, so sigma within grows and Cpk falls closer to reality. Both are defensible samples. They answer different questions, and the subgrouping decision is yours to make deliberately.
How Do You Calculate Cpk and Ppk?
Both indices need the same five inputs: the process mean, the lower specification limit, the upper specification limit, the within-subgroup standard deviation and the overall standard deviation. The only difference is which sigma each one receives.
Cpk equals the smaller of (USL minus mean) or (mean minus LSL), divided by three times sigma within. Ppk follows the identical structure with sigma overall in the denominator. When there is only a one-sided specification, use the single limit that exists.
In practice, sigma within comes from a control chart. With an X-bar and R chart, you take the average range and divide by the constant d2 for your subgroup size, five pieces giving d2 of 2.326. With an individuals and moving range chart on a short run, you average the moving ranges and divide by 1.128. Sigma overall is simply the standard deviation of the raw readings.
The 1991 ASQC/AIAG rule worth remembering
The 1991 ASQC and AIAG task force manual on fundamental statistical process control is the tie-breaker practitioners reach for: Cpk is defined using the estimated sigma, and Ppk is defined using the calculated sigma. Each index gets one sigma, and they are not interchangeable. Swapping them to make a number look better is a reporting error, not a shortcut.
If you receive a capability report, look for the two standard deviations before you read either index. In Minitab they appear in the process data block as StDev (Within) and StDev (Overall). Any Cpk value built on StDev (Overall) should be sent back.
Worked example you can check by hand
Take a feature with an LSL of 9.95 and a USL of 10.05, a process mean of 10.00, sigma within of 0.005 and sigma overall of 0.012.
Cpk equals 0.05 divided by 3 times 0.005, which is 3.33. Ppk equals 0.05 divided by 3 times 0.012, which is 1.39. The Cpk says the machine, centred, could hold this tolerance very comfortably. The Ppk says the process as actually run came within about 80 parts per million of the limits, roughly 16 times worse than the within-subgroup view suggests.
A plant that only circulated the 3.33 would have walked away from that week thinking the process was world class, while parts were being sorted at the end of the line.
How Do You Interpret Cpk and Ppk Values?
Interpret capability numbers as distances, not grades. The useful conversion is index value to equivalent sigma level, because that is how the thresholds were originally derived.
- 1.00 equals roughly one sigma of margin. The six-sigma spread exactly fills the tolerance with no room to spare. Expected defects are around 1,000 per million, or 0.1 percent.
- 1.33 equals two sigma of margin, the classic minimum most customer drawings ask for at launch. Expected defects are around 63 per million.
- 1.67 equals three sigma of margin, the level most automotive work aims for in a stable, well-controlled process. Expected defects are around 1.3 per million.
- 2.00 equals about four sigma and is often a stretch target for a new line that still has settling to do.
These are screening tools, not laws. A Cpk of 1.33 on a characteristic that costs almost nothing to replace is less urgent than a Ppk of 0.9 on a safety-critical part, and a customer requirement written in 1998 is not automatically the right target today. The number only means something once it is attached to a real risk.
The gap between the two indices is the more informative reading. Three patterns cover most cases.
- Cpk and Ppk close together: the process is stable and reasonably homogeneous. Short-term and long-term variation are the same thing, and the capability number is trustworthy.
- Cpk well above Ppk: the process is drifting, shifting or being disturbed between subgroups. This is the pattern that produces surprises on the line, and it is worth more of your attention than either number alone.
- Both low, and close together: variation itself is too large, so you need a better machine, a better setup method or a wider tolerance conversation with the customer. Recentering will not fix it.
Reporting rates in parts per million helps a leadership audience feel the difference. Minitab’s overall performance PPM comes from the Ppk calculation, and within performance PPM comes from the Cpk calculation. The ratio between those two figures is a plain-language statement of how much the process moves while nobody is watching.
When Should Plant Managers Use Cpk Instead of Ppk?
Use Cpk when the process is stable, the subgroups are rational and the question is about capability rather than performance. That combination is common at three moments: during process design and pilot runs, immediately after a capital project or a process change, and when a customer asks for evidence that the process can hold the tolerance under controlled conditions.
It is also the right number for a work cell where one machine runs one part, one material lot and one setpoint. In that situation there is very little between-subgroup variation to find, so Cpk is an honest description of the cell rather than a flattering one.
The trap is using Cpk on a long, mixed production run. When subgroups are built from parts that came off four machines, three shifts and two material lots, the variation inside each group includes machine-to-machine and operator-to-operator differences. Sigma within then absorbs sources of variation that are not short-term at all, and the resulting Cpk no longer means what the acronym suggests.
Forest Breyfogle made this point forcefully in a 2011 Quality Magazine critique, and it still holds. The same data set yields different Cpk values depending on whether an X-bar and R chart or an individuals chart is used, and subgrouping frequency alone changes the answer. If two analysts in your plant report different Cpk values for the same data, the subgrouping convention is the first thing to check, not the arithmetic.
When Should Plant Managers Use Ppk Instead of Cpk?
Use Ppk whenever the question is what the process has actually done, or whenever the data cannot support a meaningful subgroup structure. Short runs are the clearest case: a ten-part trial run or a first-article submission has no rational subgroups, so an individuals and moving range chart is the only option and Ppk is the only honest index.
Ppk is also the better choice when the process is not yet in statistical control, when production mixes machines or shifts within the study window, when raw readings are unavailable and you have only summary or min-max data, and when a customer or auditor is auditing shipped output rather than process design.
For supplier qualification, Ppk carries more weight. You are not certifying the supplier’s machine, you are judging the parts that arrived, and the between-shift differences that show up in Ppk are exactly the differences that explain a supplier complaint.
The practical answer most quality organizations settle on is to report both, always. Cpk answers whether the process is capable, Ppk answers whether it is performing, and the difference between them tells you whether to spend the next month on variation reduction or on process control.
What Do Cpk and Ppk Values Mean for Control Decisions?
Statistical process control and capability analysis answer different questions. SPC asks whether the process is behaving as it did before, using control limits derived from the data. Capability asks whether the process output fits between specification limits, which are set by design and the customer. A process can be perfectly stable and completely incapable, and it can be capable in principle while drifting badly out of control on the floor.
That is why a control chart comes first in any capability report. A Cpk of 1.67 computed on an out-of-control process describes a process that does not exist. A Minitab report that shows an out-of-control point in the X-bar chart and then reports capability numbers anyway is telling you the numbers are arithmetic, not evidence.
Diagnostic matrix: what the number pattern means
| Pattern | Likely cause | Action | Owner | Verify with |
|---|---|---|---|---|
| High Cp, low Cpk, Cpk and Ppk close | Process width is fine but the mean is off center | Recenter the process, do not buy a new machine | Process engineer | Cpk rising toward Cp after a setpoint change |
| High Cpk, low Ppk | Drift, shift differences, tool wear or unrecorded setpoint changes between subgroups | Stratify by machine, shift, operator and material, then attack the worst stream | Quality engineer with the cell lead | Ppk gap narrowing after standard work and setup discipline |
| Low Cp, low Cpk, both indices low | Too much common cause variation for the tolerance | Variation reduction project, tolerance discussion, or process redesign | Plant manager | Cp and Cpk both improving together |
| Both indices high, control chart out of control | Special cause present, the average numbers are hiding it | Stop reporting capability, find and remove the assignable cause first | Shift lead, immediately | Control chart showing no signals over a sustained period |
| Both indices high, control chart clean | Ready for release or reduced inspection | Document the study, then set a monitoring plan | Quality engineer | Sustained Ppk at or above target over the next period |
Which number goes in which meeting
This is the part most capability guidance never spells out, and it is the part a plant manager actually needs.
For the operator and the cell lead: lead with the control chart. Operators act on signals, not indices. Capability belongs in the conversation only as the reason behind a target.
For the quality engineer: report both indices with the control chart, the subgrouping convention, the time window and the measurement system study attached. This is the working document.
For the customer in a PPAP submission: follow the customer print note, and attach both numbers plus the study conditions. If the customer requires only one, send the one they require and include the other in a comment section with a one-line explanation. Practitioners on quality forums describe being switched between the two mid-project often enough that having the reasoning written down in advance pays for itself.
For plant leadership: lead with Ppk, because it is the number that reflects shipped product, and pair it with the PPM figure and the Cpk gap. The story is “we are capable of 1.67 but performing at 1.10, and the gap is shift two” rather than a bare decimal.
For finance: translate the PPM change into scrap, rework and sorting hours. Capability indices only matter to a CFO once they are expressed in parts per million and the labor they consume.
How Can You Prevent Misleading Capability Results?
Most bad capability numbers are not calculation errors. They are studies run in a way that could not have produced a meaningful answer, then quoted anyway.
- Prove stability first. Run the control chart, look for signals, and investigate them before computing anything. Special cause mixed into the dataset inflates sigma overall and makes Ppk look worse than the underlying process, or hides a drift inside a subgroup.
- Confirm the specification limits are real. A capability index measured against a limit that engineering set years ago for a different material, a different customer or a superseded drawing tells you about the drawing. Reconfirm the LSL and USL against the current released print.
- Check the measurement system. A gauge that is not capable of resolving the tolerance cannot produce a valid index. If the study gauge repeatability and reproducibility is above roughly 10 to 30 percent of the tolerance, the capability number is mostly measuring the gauge.
- Do not mix populations. Two machines, two shifts, two material lots or two operators inside one dataset will inflate the overall standard deviation and depress Ppk for reasons that are actually good news, because the causes are separable and fixable. Stratify first, then study each stream.
- Choose subgroups on purpose. Subgroups should capture only the noise you believe is short-term. Consecutive parts from one machine under constant conditions is the usual answer. Subgroup frequency and subgroup size are the two decisions that most change the Cpk you end up with.
- Look at outliers before you delete them. A point at three standard deviations may be a measurement error, a real machine fault, or the most important thing your data is telling you. Exclude it with a documented reason, never with a spreadsheet reflex.
- Test for normality rather than assuming it. Capability indices assume a normal distribution. With a small dataset that assumption is difficult to reject, which is precisely the danger. An Anderson-Darling p-value above 0.05 is weak evidence against non-normal data; below it, transform the data or use a non-normal capability method.
- Use enough data, and use recent data. At least 100 observations spread over enough time to expose drift, with subgroups large enough to estimate a range reliably. Capability computed on a single hour of production is a snapshot, not a study, and it will age badly.
- Know when the whole family is the wrong tool. Attribute data such as pass or fail, non-normal and bounded characteristics, and heavy-tailed distributions are not well served by Cp, Cpk, Pp and Ppk. For those, a proportion nonconforming comparison or a transformed non-normal analysis answers the question properly.
Which Should You Choose?
Choose Cpk for a stable, properly subgrouped process where the question is what the process is capable of. Choose Ppk for overall observed performance, for short runs, unstable processes, mixed conditions or any audit of what actually shipped. And when you are not sure, report both, because the gap between them is the most useful diagnostic on the page.
There is one more case worth planning for: the customer contract conflict. A quality engineer on a practitioner forum described being asked to switch an ongoing production submission from Cpk to Ppk and having to justify it statistically. The useful preparation is simple, and it happens before the meeting rather than during it.
Run both calculations on the same dataset. Attach the control chart showing the process is stable. State in writing which question each index answers. Then note what the gap indicates about your process, framed as information the customer gains rather than as a reason to prefer the flattering number. Most of these conversations end once the customer realises the requirement was contractual rather than statistical.
If the customer requires a threshold your process genuinely cannot meet, say so with data rather than searching for a subgrouping convention that gets you there. A supplier who quotes a number that will not hold in production creates a larger problem than the number itself.
Frequently Asked Questions
Which is better, Cpk or Ppk?
Neither is better; they answer different questions. Cpk uses the within-subgroup standard deviation and describes what the process is capable of holding under controlled conditions. Ppk uses the overall standard deviation and describes what the process actually delivered over the study period. Report both, and treat a large gap between them as a signal that the process is drifting or being disturbed between subgroups.
Can Cpk and Ppk be greater than 1.0?
No. An index above 1.0 means the six-sigma spread of the process is narrower than the tolerance window, so the parts are comfortably inside the limits. Values can reach 2.0 or higher on tight, well-controlled processes, and they can also fall well below 1.0 when the mean is off center or the variation is large. A value above 1.0 says nothing about stability.
Why should Cpk and Ppk not be compared across different products?
Because the indices are unitless ratios, not measurements. A Cpk of 1.5 on a rough casting and a Cpk of 1.5 on a tight shaft do not represent the same risk, since the tolerance width, the process mean position and the cost of an out-of-spec part all differ. Compare indices only within the same characteristic, the same specification limits and the same measurement system.
What sample size is needed for a valid capability study?
At least 100 individual observations is the usual minimum, and more if the process drifts. Group them into rational subgroups of roughly 4 to 10 consecutive parts taken under constant conditions, with enough subgroups spread over a long enough window to expose between-subgroup movement. Collecting 100 parts in one hour gives you a snapshot that will not survive a customer audit.
Does a Cpk of 1.33 prove a process is in statistical control?
No. Cpk only measures where the output falls relative to the specification limits, and it says nothing about whether the process is behaving as it did previously. A drifting process can still post a respectable Cpk because the variation is being hidden inside small subgroups. Always read the control chart first, then read the capability numbers.
How should a plant manager investigate a large gap between Cpk and Ppk?
Start by confirming both indices used the correct standard deviations, since a Cpk built on overall sigma is a reporting error. Then stratify the data by machine, shift, operator and material lot and recompute the indices for each stream. The stream with the lowest Ppk is where the between-subgroup variation is coming from, and that is the stream to fix first.
Conclusion: Start by Checking Process Stability
Cpk tells you what the process could do. Ppk tells you what it did. The gap between them is where your losses live, and a plant that reports only the flattering number will keep discovering the same problem in the same place every month.
So before you pick an index, do three things: run the control chart and fix anything out of control, confirm the measurement system can resolve the tolerance, and stratify the data by machine, shift and material so the overall standard deviation is not hiding a fixable cause. Once the data is clean, report Cpk for capability and Ppk for performance to every audience, and explain the gap between them in plain language. Updated for 2026, the rule has not changed: stability first, capability second, performance always.