
A statistical sampling plan is a written rule set that says how many pieces to pull from a lot, how to pull them, and what the inspection results must be for that lot to be accepted or rejected. Instead of testing everything, you inspect a small, randomly chosen sample and let the numbers carry the decision.
Here is statistical sampling plans explained the way a quality engineer needs it on the floor: what the standards actually say, which plan type to pick, and how to defend an accept or reject call to a customer. Last updated October 2026.
Table of Contents
- What Are Statistical Sampling Plans and Why Do They Matter?
- What Must Be Defined Before Choosing a Sampling Plan?
- How Do Acceptance Numbers and Quality Levels Work?
- How Do Attribute and Variable Sampling Plans Differ?
- Which Sampling Method Should Manufacturers Use?
- How Do General Inspection Levels Affect Sample Size?
- How Are Statistical Sampling Plans Implemented in Practice?
- How Should Sampling Results Be Interpreted?
- What Standards Are Commonly Used for Sampling?
- What Common Sampling Mistakes Should Teams Avoid?
- Frequently Asked Questions
- How do you calculate a sample size for a statistical sampling plan?
- What does AQL mean in a sampling plan?
- Is statistical sampling better than 100% inspection?
- What sample size is needed to prove a product is reliable?
- Should suppliers use the same sampling plan for every material?
- Which sampling standard applies to plastic manufactured parts?
- Conclusion
What Are Statistical Sampling Plans and Why Do They Matter?
The short version. A sampling plan converts an accept or reject decision about a lot into a documented statistical process with a known error rate, rather than an opinion at an inspection bench.
Without one, inspecting five parts out of two thousand tells you almost nothing, because you did not choose those five parts in any repeatable way. A plan fixes the sample size, the selection method, the defect definitions, and the number of defects that flips the decision.
Three practical reasons this matters:
- Cost and throughput. Inspection is labour, and labour on 100% of your output is the single largest inspection cost most plants carry. Sampling lets you inspect less and ship more.
- Destructive testing. You cannot tensile-test every molded part and then sell it. When the test consumes the sample, sampling is not a preference, it is the only option.
- Consistency. One inspector accepting lots on Monday and rejecting them on Thursday is a bigger problem than either decision alone.
What sampling cannot do is certify a lot as defect-free. An accepted lot is a bet made at stated odds, not a guarantee.
What Must Be Defined Before Choosing a Sampling Plan?
You cannot pick a plan until six things are written down. Most disputes over sampling plans are really disputes about one of these six.
The inspection lot
A lot is the group of pieces the decision applies to. It has to be homogeneous: one part number, one revision, one production run, one set of process conditions. If the lot definition is vague, every number in the plan becomes meaningless.
The sample unit
The unit is what counts as one for the inspection. On a multi-cavity injection tool, a cavity is not a piece. Decide whether a piece is one full molded part, one shot, or one carton, and record it.
The defect classes
Defects are usually sorted by consequence, and the class sets the AQL:
| Defect class | What it covers | Typical AQL | Usual consequence of failure |
|---|---|---|---|
| Critical | Safety, regulatory, or loss of primary function | 0, meaning Ac = 0 | Lot rejected on the first find, often followed by 100% screening |
| Major | Affects function, fit, assembly, or the customer experience | 0.10 to 0.65 | Rework, sort, or supplier corrective action |
| Minor | Cosmetic, does not affect use | 1.0 to 2.5 | Rework or use as is |
Some organizations split major into critical-major, major and minor-major, then bundle them into two inspection classes. That grouping is older military practice that migrated into commercial plans, and it is worth keeping if your customer still asks for it.
Defectives versus nonconformities
A defective is a piece with one or more defects, counted once. A nonconformity is each individual defect occurrence, counted every time. A dented panel with four scratches is one defective or four nonconformities, and the two plans built on those counts have different sample sizes. Pick one and state it in the plan.
Product risk and customer requirements
A cosmetic cap and a structural snap fit can arrive in the same lot size and still need very different AQL values. Your customer’s contract or drawing often dictates the numbers, and your own risk assessment decides the rest.
The decision the sample has to support
Is this lot going out to a customer, coming in from a supplier, or feeding a process you are trying to measure? Acceptance sampling answers lot questions. Process questions belong to statistical process control, which we cover in SPC charts for injection molding explained.
How Do Acceptance Numbers and Quality Levels Work?
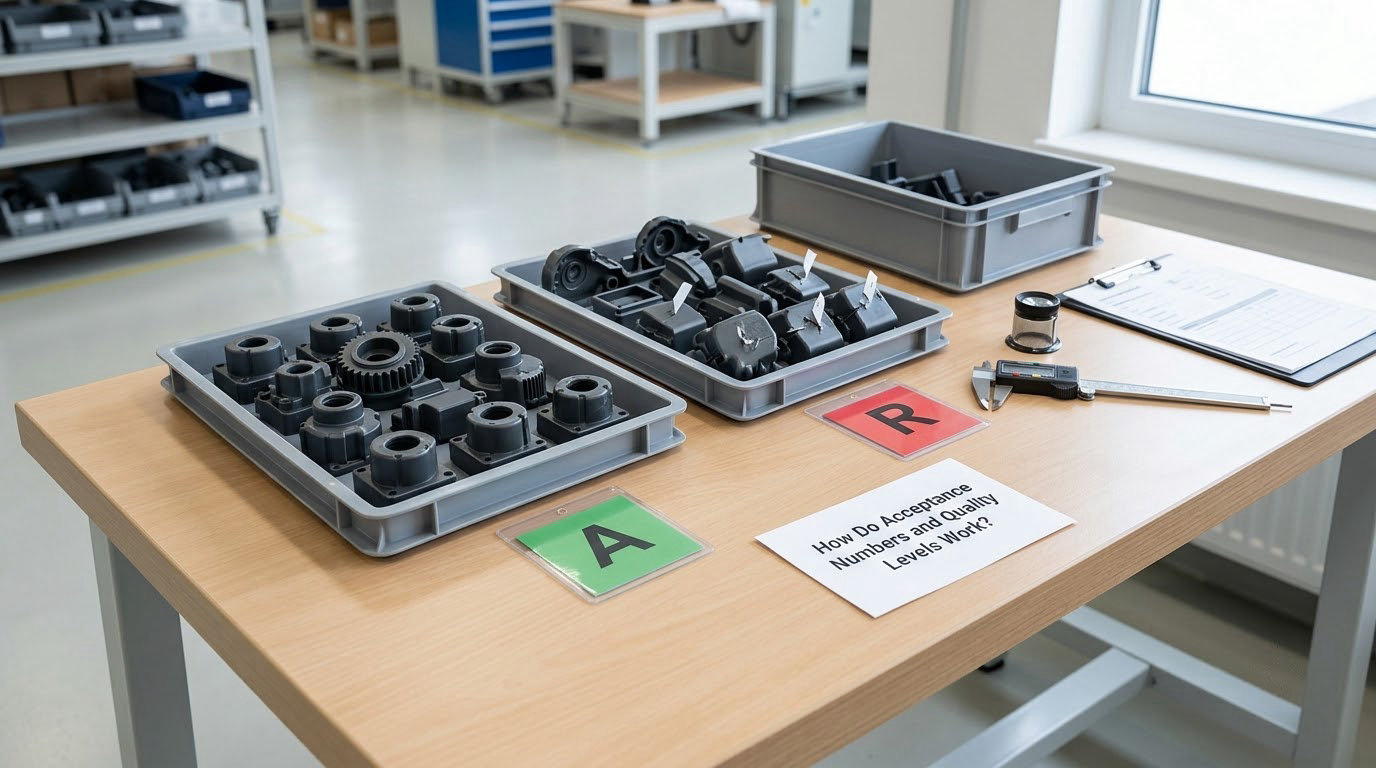
Ac and Re are the two numbers that do the actual work. Ac is the acceptance number: the highest number of defectives or nonconformities you can find and still accept the lot. Re is always Ac plus one. Hit Re and the lot is rejected.
That sounds simple until you see what sits behind it. AQL, the acceptable quality limit, is the quality level a plan is built around: the percent nonconforming that the plan is designed to accept most of the time. It is an index into a sampling table, not a target you are promising the customer and not the actual defect rate of the lot in front of you.
Two more terms carry the risk:
- Producer’s risk (alpha) is the chance that a good lot gets rejected. From the plant’s side that is a bad day: you sorted good parts for nothing.
- Consumer’s risk (beta) is the chance that a bad lot gets accepted. From the buyer’s side that is the expensive failure, and it is why an AQL is never zero.
- LTPD, the lot tolerance percent defective, is the quality level at which you want the acceptance probability to fall low.
The curve connecting these is called the OC curve, the operating characteristic curve. Read it left to right and you are looking at probability of acceptance as quality rises: high at good quality, dropping steeply past the AQL, low at the LTPD. The sharper the drop, the more discriminating the plan and the larger the sample.
Below is a slice of the sample size code letter table used for single plans at general inspection level II. Lot size in, code letter out, then sample size.
| Lot size range | Sample size code letter | Sample size n |
|---|---|---|
| 26 to 40 | D | 8 |
| 41 to 60 | E | 13 |
| 61 to 80 | F | 20 |
| 81 to 100 | G | 32 |
| 101 to 150 | H | 50 |
| 151 to 200 | J | 80 |
| 201 to 300 | K | 125 |
| 301 to 500 | L | 200 |
| 501 to 700 | M | 315 |
| 701 to 1000 | N | 500 |
| 1001 to 1500 | P | 800 |
| 1501 to 2000 | Q | 1250 |
| 2001 to 3200 | R | 2000 |
How a statistical sampling plan is written down
A workable example. You receive a lot of 1000 injection-molded housings, general inspection level II, one part number, one production date, nothing else in the lot. You classify defects as critical, major and minor, with critical set to zero tolerance.
From the lot size and inspection level you get your code letter, and from the code letter and your AQL you read three numbers out of the table: the sample size n, and the Ac and Re pair printed for that AQL column. Suppose your copy of the table gives n = 500, Ac = 10 and Re = 11 for the major-defect column at your chosen AQL.
The inspector draws 500 pieces at random from the lot, which in practice means from at least four or five locations across the shipment rather than from the pallet nearest the door. On a blended shipment the plan may require taking a specified number from every carton.
Then the findings decide it:
| What the sample shows | Comparison | Decision |
|---|---|---|
| 8 pieces with major defects, no critical defects | 8 is at or below Ac 10 | Accept the lot |
| 11 pieces with major defects | 11 reaches Re 11 | Reject the lot |
| 1 piece with a critical defect, in any class | Critical AQL is 0, so Ac = 0 | Reject immediately, regardless of other counts |
| 21 minor nonconformities, major count at 4 | Minor column has its own Ac and Re pair | Compare each class separately, then take the worst outcome |
Two habits make this defensible. Inspect every defect class separately rather than pooling them, because the acceptance numbers are built per class. And record the numbers before anyone knows the outcome, because a decision written after the count drifts.
How Do Attribute and Variable Sampling Plans Differ?
Attributes inspection asks yes or no. Variables inspection measures. That single difference changes how much you learn from each piece.
| Attributes | Variables | |
|---|---|---|
| Data recorded | Pass or fail, or a defect count | A measured value such as 2.42 mm |
| Information per piece | One bit | A full position in a distribution |
| Typical sample size | Larger | Often smaller for the same discrimination |
| Needs | Agreed defect definitions and classification | A capable measurement system, tolerance limits, and a known or estimated process sigma |
| Main standard | ISO 2859-1 | ISO 2859-2 and ISO 2859-3 |
A plastic example of each. Attributes: pull 200 molded covers and count the ones with short shots, sink marks, or flash. One piece either conforms or it does not.
Variables on the same covers: measure wall thickness at four points on each piece and compare the readings against the tolerance. Twenty measurements can tell you the process has drifted even when every piece still passes, which the attribute count cannot do.
Variables plans do carry assumptions. They lean on the distribution of measurements being predictable, which means the process needs to be stable first, and they need a measurement system that can actually resolve the tolerance. Our guide to plastic part tolerance standards explained covers where those limits normally sit.
Choose attributes when defects are obvious, subjective, or judged against a golden sample. Choose variables when the requirement is a number, the measurement is repeatable, and a small sample should still be convincing.
Which Sampling Method Should Manufacturers Use?
Once you have attributes or variables, you still choose a plan structure. Each one buys something with inspection effort or decision speed.
| Plan type | How it works | Decision speed | Where it fits |
|---|---|---|---|
| Single | One fixed sample, one decision, no second chance | Fastest, always | Low volume, destructive or expensive inspection, tight schedules |
| Double | First sample, with a second sample only if the count lands in the grey zone | Slower, average sample smaller | Lots that routinely sit near the AQL, where a single plan over-inspects good lots |
| Multiple | Five or more samples with pooled evidence | Slowest decision, smallest average sample | Very high volume, low-risk streams such as electronic components |
| Sequential | Keeps sampling until the accumulated evidence supports a decision | Variable, occasionally very large | Process monitoring and continuous sampling schemes rather than lot acceptance |
| Skip-lot | Inspects only a random share of lots in a series and skips the rest | Fastest of all | Stable suppliers with years of data |
| Chain | Small fixed sample each lot, with results carried forward and accumulating | Fast, low inspection burden | Extremely high volume where quality is steady |
| 100% inspection, c = 0 | Every piece checked, no sampling risk | Slowest | Critical characteristics, regulated tests, and anything automated inspection can handle |
Skip-lot deserves a warning. It quietly reduces your coverage, so it does not belong on regulated parts, customer-mandated incoming inspection, or anything where the contract says every shipment gets sampled. If your customer expects a piece count on every receipt, skip-lot breaks that promise.
Single sampling is the sensible default for most small and mid-size plants. It is one number to remember and one decision to make, which matters more on a busy floor than a five percent saving in average sample size.
How Do General Inspection Levels Affect Sample Size?
Inspection level sets the risk you are willing to carry in the sampling itself. The lot size gives you a code letter at that level, and the code letter sets the sample size.
- Level I accepts more producer’s risk. Smaller samples, and the usual choice when inspection is destructive, when lots are large and homogeneous, or when a rejection costs more than the defects would.
- Level II is the normal default and the level most published tables assume. Start here unless something specific argues otherwise.
- Level III shifts risk to the consumer. Larger samples, and the right choice for expensive parts, aerospace and medical work, or any lot where scrapping a good one is expensive.
The same lot therefore produces three different sample sizes depending on level. A lot of 1000 pieces maps to code letter N at level II, and the code letter either side of it moves the sample size by roughly a factor of two in each direction.
AQL then shifts it again, because the table gives a different Ac and Re pair at each quality column. Tighten the AQL and the acceptance number drops, so a given lot can be inspected at fewer pieces under a looser limit than under a strict one. There is no shortcut formula here, and anyone offering one without the lot size, level and AQL has not read the tables.
How Are Statistical Sampling Plans Implemented in Practice?
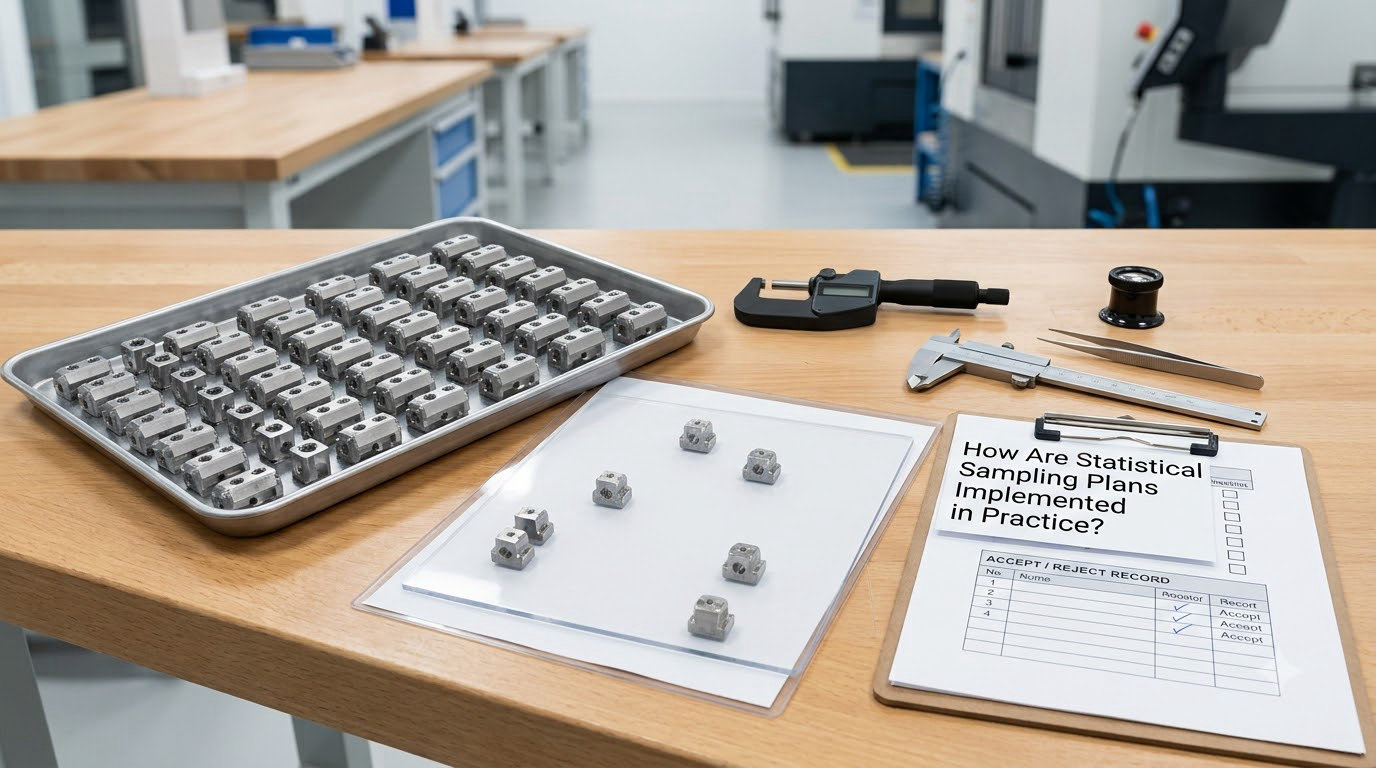
The procedure is the same almost everywhere. The part that goes wrong is usually step two.
- Identify the lot. Record part number, revision, work order, quantity, date code, and where the pieces are physically located.
- Select the units randomly. Use a documented method such as a numbered lot list with a random start, or a selection grid over the shipment. Taking pieces from one end, or from the top of the nearest carton, is the most common failure in the whole process.
- Record the inspection standard. The drawing revision, defect class definitions, AQL, inspection level, and sample size go on the sheet before inspection starts.
- Inspect to the standard. Attribute plans use pass or fail against a defined defect list. Variables plans use a calibrated instrument and a documented measurement point.
- Record each defect count by class. Keep classes separate and note the location and type of anything you judge borderline.
- Compare against Ac and Re. Every class gets its own comparison.
- Decide accept or reject and record the disposition. Accept, reject, sort, rework, or use as is, with a name and a date.
- Apply the switching rules and feed the process data back. Lot history is what moves you between normal, tightened, and reduced inspection.
Switching rules are where most hand-rolled plans are missing. The common pattern under normal inspection: reject two of the last five lots and you move to tightened inspection; accept ten consecutive lots under tightened and you may drop to reduced; a single rejection under reduced sends you straight back to normal. Check the rule text in your copy of the standard, because the exact trigger conditions differ between editions.
Randomness is the part that gets skipped under schedule pressure, and it is the part that makes the statistics real. A biased sample produces a confident number about the wrong subset of parts.
How Should Sampling Results Be Interpreted?
An accepted lot is not defect-free. The plan accepted it because the sample count came in at or below Ac, which says something about the probability the lot meets your requirement, not that every piece meets it. Reviewers on quality forums make this point constantly, usually after a customer found defects in a lot that had passed.
A rejected lot is not proof that every piece is defective either. It means the sample gave enough evidence of nonconforming quality to send the lot to a decision path, and the usual response is sorting, 100% inspection, or rework rather than scrapping.
Follow-up actions after a rejection usually run in this order:
- Contain the lot and identify whether earlier lots are implicated.
- Sort or inspect 100% to separate good pieces from bad ones.
- Rework or use as is, only with the customer informed if the deviation affects function.
- Raise supplier corrective action when the lot came in from outside.
- Tighten inspection on the next lots and check whether the cause is process or measurement.
And when a supplier’s report says the lot passed, check the parts you are actually disputing. Suppliers and buyers classify the same dent differently often enough that a shared list of defect examples, or golden samples, resolves more arguments than any statistic.
What Standards Are Commonly Used for Sampling?
Most of the world’s acceptance sampling work runs on one short list of standards. The important thing is knowing which edition your contract names.
| Standard | Covers | Current status |
|---|---|---|
| ISO 2859-1 | Attributes, lot-by-lot, AQL-indexed single, double and multiple plans, switching rules | Current international standard |
| ANSI/ASQ Z1.4 | The same system as ISO 2859-1, in the US wording | Current, still referenced by older contracts |
| ISO 2859-2 | Variables plans, percent defective | Current |
| ISO 2859-3 | Variables plans, percent nonconforming | Current |
| ANSI/ASQ Z1.9 | Variables plans, US wording | Current |
| MIL-STD-105E | Attributes, US military origin | Cancelled in the 1990s, superseded by ANSI/ASQ Z1.4 |
| MIL-STD-414 | Variables, US military origin | Cancelled, superseded by ANSI/ASQ Z1.9 |
| BS 6001 | Attributes, UK adoption of the Z1.4 system | Withdrawn in favour of BS EN ISO 2859-1 |
Beyond the sampling standards, quality systems set the surrounding rules. ISO 9001 clause 8.7 asks you to control nonconforming outputs but does not tell you to sample, so acceptance sampling there is your choice. ISO 13485 dropped the general permission to sample, so a medical device manufacturer relying on sampling instead of full verification inspection has to justify it statistically. Automotive supply adds customer-specific requirements on top; our comparison of IATF 16949 vs ISO 9001 differences explained covers what changes under that framework.
Confirm the edition before you buy the standard or accept a supplier’s plan. Code letter ranges, Ac and Re values, and switching triggers have all been revised between printings, and a report built on an old table is a real audit finding.
What Common Sampling Mistakes Should Teams Avoid?
- Sampling from one end of the lot. Fix: use a documented random selection across the full shipment, and write the method down.
- Changing defect definitions mid-inspection. Fix: agree the definitions and examples before the first piece is examined.
- Treating AQL as the quality the customer receives. Fix: AQL indexes the table. Actual outgoing quality is described by the OC curve and average outgoing quality, not by the AQL number.
- Applying the 10% rule as a general practice. Fix: the 10% rule is a narrow allowance tied to a supplier’s capability to prove that defects are not concentrated in the sample. It is not a shortcut for sampling a percentage of the lot.
- Using a plan outside its scope. Fix: attributes tables do not apply to destructive reliability testing, and design verification sample sizing is a different calculation entirely.
- Failing to document lot disposition. Fix: record the decision, the counts, the disposition, and who signed it.
- Reading a reject as proof every piece is bad. Fix: sort, then decide between rework, use as is, and scrap.
- Selecting an arbitrary sample size. Fix: if the number did not come from a code letter, an AQL column, or a stated reliability calculation, document the reasoning behind it instead.
Frequently Asked Questions
How do you calculate a sample size for a statistical sampling plan?
In practice you read it from a table rather than calculating it. Define the lot, choose an inspection level, look up the sample size code letter for that lot range, then read the sample size for your plan type at your AQL. For variables plans you can size a plan with a formula based on producer and consumer risk and the AQL and LTPD points, but most shops go straight to the standard tables.
What does AQL mean in a sampling plan?
AQL is the acceptable quality limit: the percent nonconforming a lot is allowed to contain and still be accepted most of the time. It is an index into a sampling table, not a quality target and not a guarantee. A plan set at AQL 2.5 gives roughly a 95 percent chance of accepting a lot at 2.5 percent defective and a much lower chance of accepting a lot at 2.5 times that level.
Is statistical sampling better than 100% inspection?
Sampling wins on cost, throughput, and destructive testing. It cannot beat 100 percent inspection on certainty, and it does not prove a lot is defect-free. Most shops use sampling on discrete attributes for lot acceptance and reserve 100 percent inspection for critical characteristics, regulated checks, and automated screening that a person could not realistically run all day.
What sample size is needed to prove a product is reliable?
No sample proves reliability, it only bounds the uncertainty. For attribute pass and fail tests, size the test from a required confidence level and an acceptable failure rate. For time or load to failure data, use reliability methods such as Weibull analysis or a zero-failure demonstration based on the distribution and the confidence you need. Set the number from those targets, then document the assumptions.
Should suppliers use the same sampling plan for every material?
No. The plan should follow the risk of the part and what can go wrong, not the material it is made from. A cosmetic housing and a structural snap fit can arrive in the same lot size and still need very different AQL values and defect classes. Long-term supplier qualification, history, and the customer contract usually justify relaxed inspection far better than any material label does.
Which sampling standard applies to plastic manufactured parts?
For custom molded and injection molded plastic parts, ISO 2859-1 covers attributes inspection, or ANSI/ASQ Z1.4 where the buyer specifies the ANSI version. For measured characteristics such as wall thickness, weight, and shrinkage, use ISO 2859-2 or ISO 2859-3, with ANSI/ASQ Z1.9 in US contracts. Automotive work on the same parts usually adds customer-specific requirements on top.
Conclusion
Start with the lot, not the sample size. Define what a lot is, classify the defects by consequence, set zero tolerance on anything critical, and write down the decision the sample has to support.
Then confirm which standard governs the situation, since your customer’s contract usually names it, pick the inspection level that matches your risk, and read n, Ac and Re from the table. Choose a single sampling plan unless your volumes justify something cleverer, and record the disposition every time.
A plan you can explain in one paragraph beats a sophisticated one nobody on the floor understands.