
An acceptable scrap rate in plastic manufacturing sits under 3% for most steady-state molding and extrusion work, and under 1% for tight-tolerance, cosmetic, or medical-grade parts. Scrap rate benchmarks for plastic manufacturing are only useful when you know the process, the part complexity, and the measurement convention behind the number, because a 2% figure from a profile line and a 2% figure from an automotive molding cell rarely describe the same thing. This guide gives you the reference bands, the formulas, and a method for setting a target your own plant can defend.
One point to keep in mind while reading: almost every “industry standard” scrap figure on the internet traces back to metalworking or general discrete manufacturing data. Plastics-specific benchmark data is not published as a standalone reference, so the numbers below are planning ranges, not guarantees. Treat them as the starting line, not the finish line.
Table of Contents
- What Are Scrap Rate Benchmarks for Plastic Manufacturing?
- How Do You Calculate Scrap Rate?
- What Factors Change the Appropriate Benchmark?
- Scrap Rate Benchmarks by Manufacturing Process
- How to Set a Target for Your Plastic Product
- How to Reduce Scrap Without Hiding Quality Problems
- How to Report Scrap Rate to Operations and Finance
- Frequently Asked Questions
- What is a good scrap rate for plastic manufacturing?
- Are scrap rate benchmarks different for injection molding and extrusion?
- Should regrind be counted as scrap?
- How should a manufacturer set its first scrap rate target?
- How do cosmetic and tight-tolerance parts affect the benchmark?
- How can a plant reduce scrap without increasing defects or customer returns?
- Conclusion
What Are Scrap Rate Benchmarks for Plastic Manufacturing?
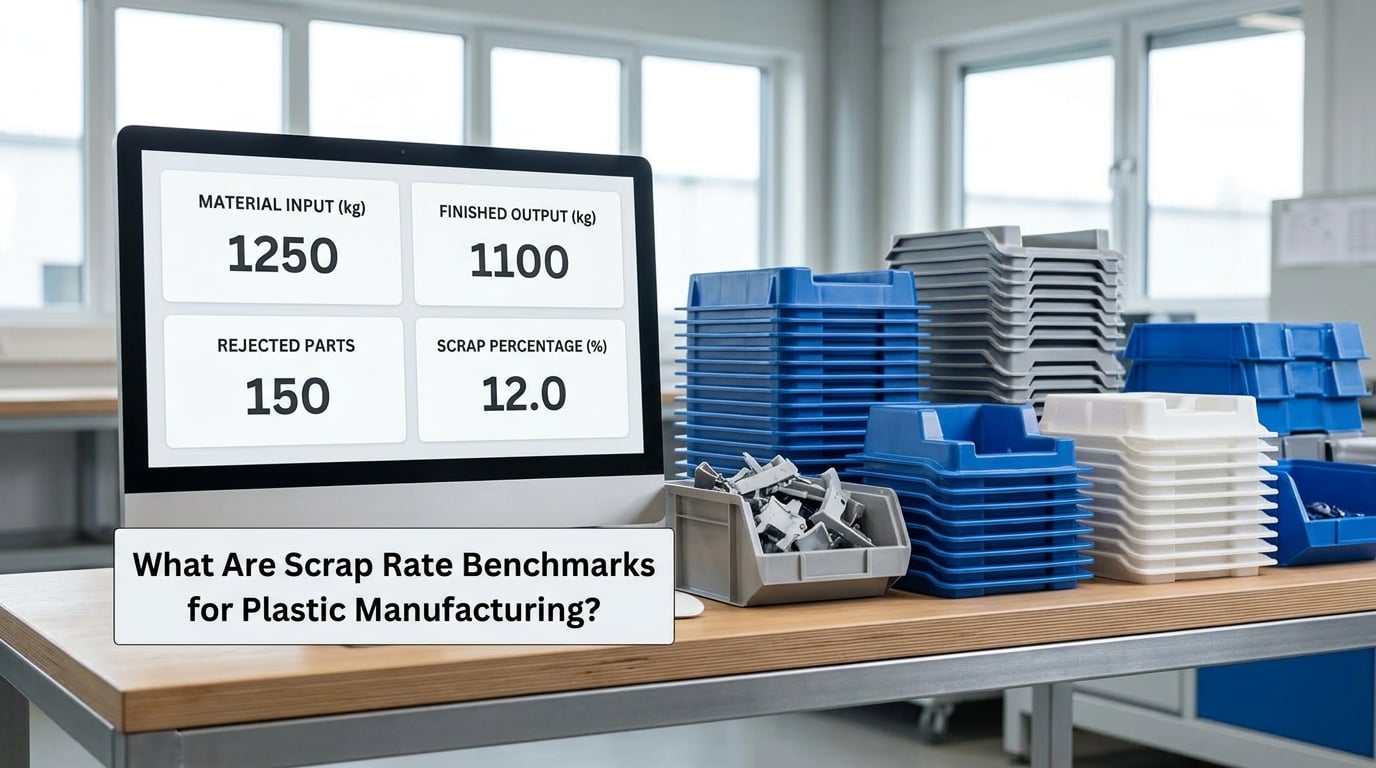
Scrap rate is the share of material processed, or parts produced, that is rejected, reground, or discarded and cannot become a saleable part. It can be measured two ways. The part-count basis divides rejected pieces by total pieces produced, and the material-mass basis divides the weight of scrap by the weight of resin issued to the line. Plants pick one, often without saying so, which is why two plants can both claim “2%” and disagree about who is doing better.
The general band ladder used in discrete manufacturing reads like this, and it holds up reasonably well for plastics as a diagnostic rather than a target.
| Scrap rate | Rating | What it usually signals |
|---|---|---|
| Under 1% | Excellent | Controlled process, high-capability tooling, stable material |
| 1% to 3% | Healthy operating range | Normal start-up, changeover, and minor process drift |
| 3% to 5% | Watch | Tooling wear, resin variability, or loose process control |
| Over 5% | Process problem | Material, tooling, or process-control failure worth investigating |
Typical planning ranges by process, before you adjust for part complexity:
| Process | Typical range | Measurement note |
|---|---|---|
| Injection molding, commodity parts | 1% to 3% | Part-count basis, start-up excluded |
| Injection molding, cosmetic or tight-tolerance | 2% to 5% | Part-count basis, cosmetic rejects included |
| Profile extrusion, steady-state | 1% to 2% | Mass basis, cut lengths and die runs |
| Thermoforming | 8% to 20% | Mass basis, trim scrap dominates the number |
| Blow molding | 2% to 5% | Part-count basis, flash and par weight |
| Rotational molding | 3% to 8% | Mass basis, mold loading losses |
The thermoforming band looks alarming next to the others, and it is not an error. A thermoformer mechanically trims skeletons out of a sheet, so a meaningful fraction of every pound of feedstock leaves as skeleton regrind by design. Comparing a thermoformer to an injection molder on scrap rate without naming the process is meaningless, which is exactly why per-process bands matter more than a single plant-wide target.
How Do You Calculate Scrap Rate?
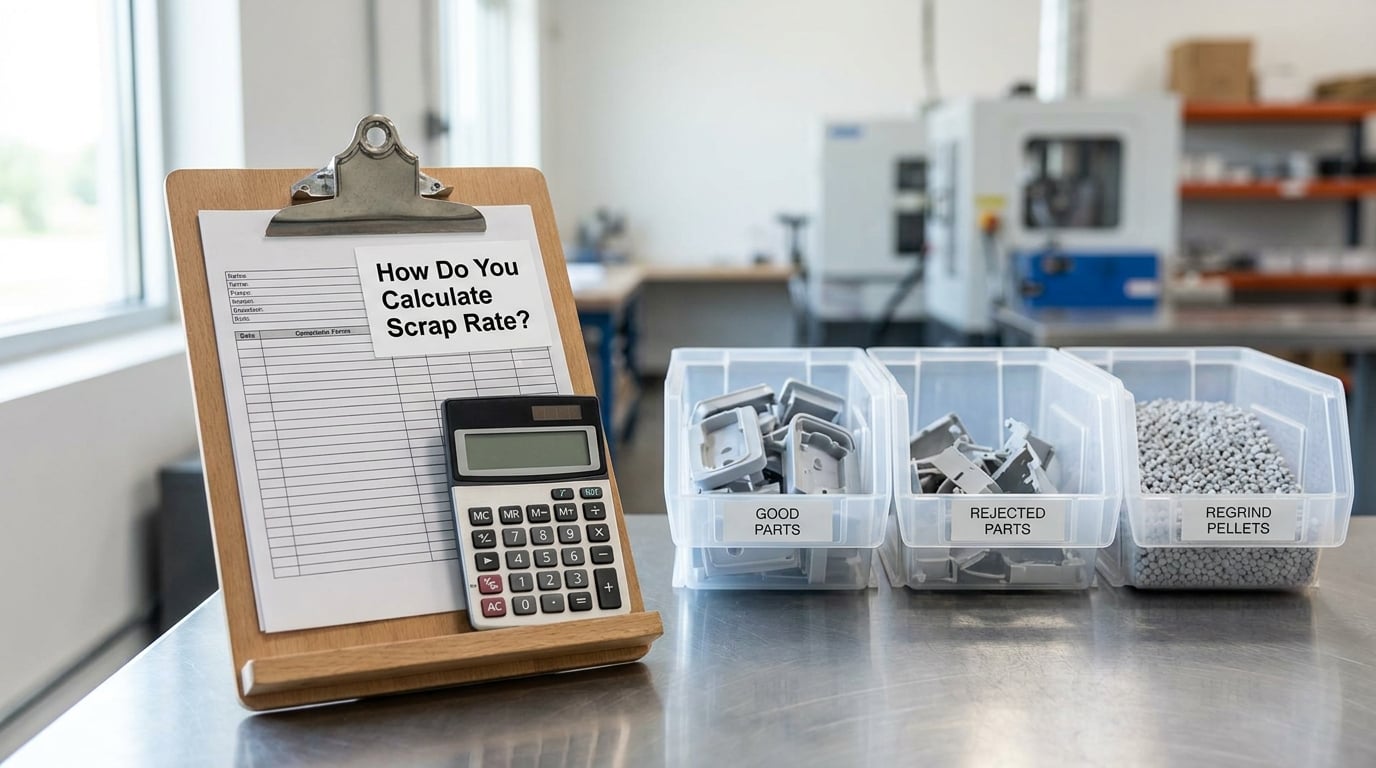
Four calculations cover almost everything a plant needs, and each one answers a different question.
- Part-count scrap rate = rejected parts ÷ (good parts + rejected parts) × 100. Use it when parts are the saleable unit and weights are consistent.
- Material-mass scrap rate = weight of scrap ÷ total material issued × 100. Use it for extrusion, sheet, and anything where resin issued and resin shipped diverge.
- First-pass yield = good parts on the first pass ÷ total parts produced × 100. It equals 100 minus scrap rate when nothing is reworked.
- Scrap cost = scrap mass × resin cost per unit mass, plus the conversion, labor, and machine time already spent on the scrapped parts.
A worked example shows why the basis matters. Suppose an injection cell issues 200 kg of resin and produces 16,000 good parts weighing 12.2 g each. Good part mass is 195.2 kg, so the mass-basis scrap rate is 2.4%. Now count the rejects: 180 pieces went to the scrap bin, which puts the part-count rate at 180 ÷ 16,180 = 1.1%. Same lot, same shift, two different percentages. Neither is wrong, and a supervisor comparing the 2.4% to a molding benchmark is measuring the wrong thing.
Before you finalize any number, sort material into four buckets so nothing double-counts:
| Category | What belongs here | Count it as scrap? |
|---|---|---|
| Internal scrap | Rejected parts, short shots, flash, off-color, damaged parts | Yes |
| Rework | Parts repaired or re-run and then shipped | Track separately |
| Regrind | Grind from internal scrap returned to the process | Count once, at origin |
| Customer returns | Material returned after shipment | Separate quality metric |
The regrind row is the one that trips most plants. If you count internal scrap when it is binned and then count the same material again when the regrind rate is re-run, you have inflated the rate by double. A separate regrind reuse rate is the right companion metric.
What Factors Change the Appropriate Benchmark?
A 4% rate can be excellent for one part and a crisis for another, so the benchmark has to move with the job. This is the diagnostic most plants skip.
| Factor | Effect on the acceptable rate |
|---|---|
| Resin grade | Higher flow and better batch consistency widen the process window |
| Part complexity | Thin walls, long flow paths, and multi-cavity tools raise rejects |
| Tool condition | Worn cavities and gates cause drift before failure is visible |
| Cycle time demand | Running the cycle faster than the process window costs yield |
| Tolerance level | Tighter GD&T shifts the limit from cosmetic to functional |
| Color specification | Color-critical parts reject on appearance, not function |
| Start-up and changeovers | Short runs carry proportionally huge warm-up loss |
| Rework tolerance | Parts you can repair are rework, not scrap |
| Recycled content | PCR feedstock adds lot-to-lot color and viscosity variation |
Resin grade deserves emphasis because it is the factor plants can change without touching a machine. A supplier’s tighter melt-flow and color specification frequently does more for the rate than a maintenance improvement does.
Scrap Rate Benchmarks by Manufacturing Process
Each process has a different dominant loss mechanism, so the benchmark and the cause travel together.
| Process | Planning range | Mature target | Dominant loss source |
|---|---|---|---|
| Injection molding, commodity | 1% to 3% | Under 1.5% | Short shots, flash, start-up |
| Injection molding, cosmetic | 2% to 5% | Under 2.5% | Appearance rejects, sink marks |
| Profile extrusion | 1% to 2% | Under 1% | Die runs, thickness variation, purge |
| Thermoforming | 8% to 20% | Under 10% | Skeleton trim waste |
| Blow molding | 2% to 5% | Under 3% | Par weight, flash, wall variation |
| Rotational molding | 3% to 8% | Under 4% | Mold loading, release failures |
| Recycled or PCR feedstock runs | Add 1 to 3 points | Set per blend | Color drift, re-blend events |
These are directional. An injection molding shop that quoted 14.5% scrap before automating and 0.08% after was not dishonest about its number, it was a start-up-dominated operation with a badly controlled tool. Conversely, a profile line that holds 1% for months is genuinely at the mature end of the band.
Conditions that push a process past its band are worth naming plainly. Short production runs on a high-cavity tool scatter start-up losses across very few parts. A color changeover on a coextrusion line can generate more purge material than a full day’s steady-state run. And recycled feedstock structurally raises the rate: one extruder running 30% PCR polycarbonate for an LED diffuser shipped three lots within color spec before the fourth drifted outside the customer’s tolerance and needed re-blending with virgin pellet to recover.
How to Set a Target for Your Plastic Product
Setting a defensible target takes six steps, and skipping the first two is how plants end up chasing a number they can never hit.
- Measure a real baseline. Pull 8 to 12 weeks of actual data for that specific part on that specific line. If the data does not exist yet, counting bins by hand for two weeks beats guessing.
- Separate start-up from steady state. Report the first N parts after a change, a tool open, or a material transition as its own rate. A monthly number that blends warm-up with steady production tells you nothing about process capability.
- State the convention on the report. Part-count or mass basis, whether regrind counts, whether purge counts, and the period covered. Write it on the same page as the number.
- Pick a pilot target. Aim at the planning range for your process, not at the 1% world-class figure. A first target of 2.5% on a cosmetic part is honest; 0.8% is a promise you will miss.
- Add a controlled improvement margin. Reduce by roughly a quarter, not to the floor. Aggressive first targets produce a month of bad data and no lasting process change.
- Review by line, shift, tool, material, and defect category. A plant-wide average hides everything interesting. The defect category usually identifies one controllable cause worth more than the rest combined.
How to Reduce Scrap Without Hiding Quality Problems
The fastest reductions come from process capability work and material handling, not from inspection speed. These are the methods that hold up under audit.
Work the process window before the parts. Capability studies on the dimensions that drive rejects, Cpk on thickness for extrusion, and a control plan with defined limits tell you whether the machine can hold the part at all. In-process probing and machine vision catch drift early, but they do not substitute for a capable process.
Control material drying and handling. Moisture in hygroscopic resins causes splay and viscosity loss, and regrind mixed in by weight without metering changes flow every time it is charged. Requiring resin to be weighed to a written procedure removes a whole category of intermittent scrap.
Run preventive maintenance on a schedule tied to cycle counts. Cavity wear, heater thermocouple drift, and nozzle degradation all show up as gradual yield loss long before they show up as a breakdown.
Set tool setup standards. Documented first-article checks and documented gate, temperature, and pressure settings shorten the search when a part goes off. Setup sheets written during a good run outperform anything reconstructed from memory.
Train operators against a defect photo library, then let operators run the machine. Layered process audits that hit a set number of processes each day are a practical way to keep standards from drifting between shifts.
One guardrail, stated plainly: scrap does not get reduced by relaxing a customer specification, a regulatory requirement, or a safety-critical dimension. Any of those produces a short-term drop in scrap rate and a long-term increase in returns, warranty work, and audit findings. If a reduction requires a spec change, it goes through change control, not a quiet decision on the floor.
How to Report Scrap Rate to Operations and Finance
Operations and finance frequently argue about scrap because they are reading different numbers. A single reporting format fixes it faster than a meeting.
| Field | What it holds |
|---|---|
| Total scrap mass | All material rejected, in the reported period |
| Internal rework | Repaired or re-run parts, not counted as scrap |
| Recoverable regrind | Scrap that returns to the process, tracked at origin |
| Net material loss | Scrap that leaves the site and is not reground |
| Defect reason | Coded category for the dominant loss |
| Estimated cost | Material, conversion, labor, machine time, freight |
| Measurement basis | Part-count or mass, and what is included |
Cost reporting is where the biggest number usually hides. Most plants capture resin value and stop there, which understates the true cost of scrap by 30 to 50% because the machine time, labor, regrind grinding, and disposal were already spent. Recovered regrind value offsets part of that, but it never offsets the labor and energy.
Each team then reads the same sheet differently. Plant management uses net material loss by line. Production supervisors use defect reason codes to staff and sequence work. Purchasing uses supplier-affected scrap to justify material specification changes. Finance uses the full cost figure for margin analysis. The numbers match because the definitions match.
Frequently Asked Questions
What is a good scrap rate for plastic manufacturing?
Under 3% is a reasonable steady-state target for most injection molding and extrusion operations, and under 1% is generally considered world-class. Between 1% and 3% is a healthy operating range that covers normal start-up and changeover loss. Above 5% usually points to a material, tooling, or process-control problem rather than normal cost of doing business. Always state your measurement basis, since part-count and mass-basis rates differ.
Are scrap rate benchmarks different for injection molding and extrusion?
Yes. Injection molding commodity parts typically plan at 1% to 3%, while profile extrusion steady-state usually sits at 1% to 2% because extrusion lines trim continuously and generate cut-length and die-run material. Thermoforming is much higher, often 8% to 20%, because skeleton trim waste is inherent to the process. Comparing processes without naming the process produces meaningless plant-to-plant comparisons.
Should regrind be counted as scrap?
Count it once, at the point of origin. When internal material is rejected, that rejection is scrap. If the grind goes back into the process, track it as a separate regrind reuse rate rather than counting the same mass again. Double-counting is the most common reason a plant’s scrap rate looks worse than its material flow actually is, and it is also why gross scrap rate can hide a degrading net material yield.
How should a manufacturer set its first scrap rate target?
Measure an 8 to 12 week baseline for that specific part on that specific line, then separate start-up and changeover losses from steady-state production. State the measurement convention on the report. Set the pilot target inside the planning range for your process rather than at the world-class figure, then plan to close the gap gradually by defect category. Review by line, shift, tool, material, and reason code so one controllable cause surfaces.
How do cosmetic and tight-tolerance parts affect the benchmark?
They raise the acceptable rate, because the part is rejected for appearance rather than function. Cosmetic injection molding commonly plans at 2% to 5% against 1% to 3% for commodity parts. Color-critical work judged on a color tolerance is judged by eye or by instrument, so lighting conditions and observer training on the line become part of your process control. Tight-tolerance parts also reject on dimensional capability rather than appearance, which points to tooling and process window work.
How can a plant reduce scrap without increasing defects or customer returns?
Improve process capability, material handling, and maintenance before speeding up inspection. Run capability studies on the dimensions that drive rejects, tighten resin drying and metering standards, and schedule maintenance by cycle counts. Document tool setup standards from a known-good run. If a reduction requires relaxing a customer or regulatory requirement, that is a change-control decision, not a floor decision, because the short-term scrap saving arrives with higher returns and warranty cost.
Conclusion
Start by measuring what you actually have: pick one part, one line, and one quarter, then count scrap by mass and by part count with start-up separated out. Compare that figure against the planning range for your process, not against a plant-wide target someone brought back from a conference. Then pick the single largest defect category and fix its cause first, because that one step usually moves the number further than any reporting change you can make.