
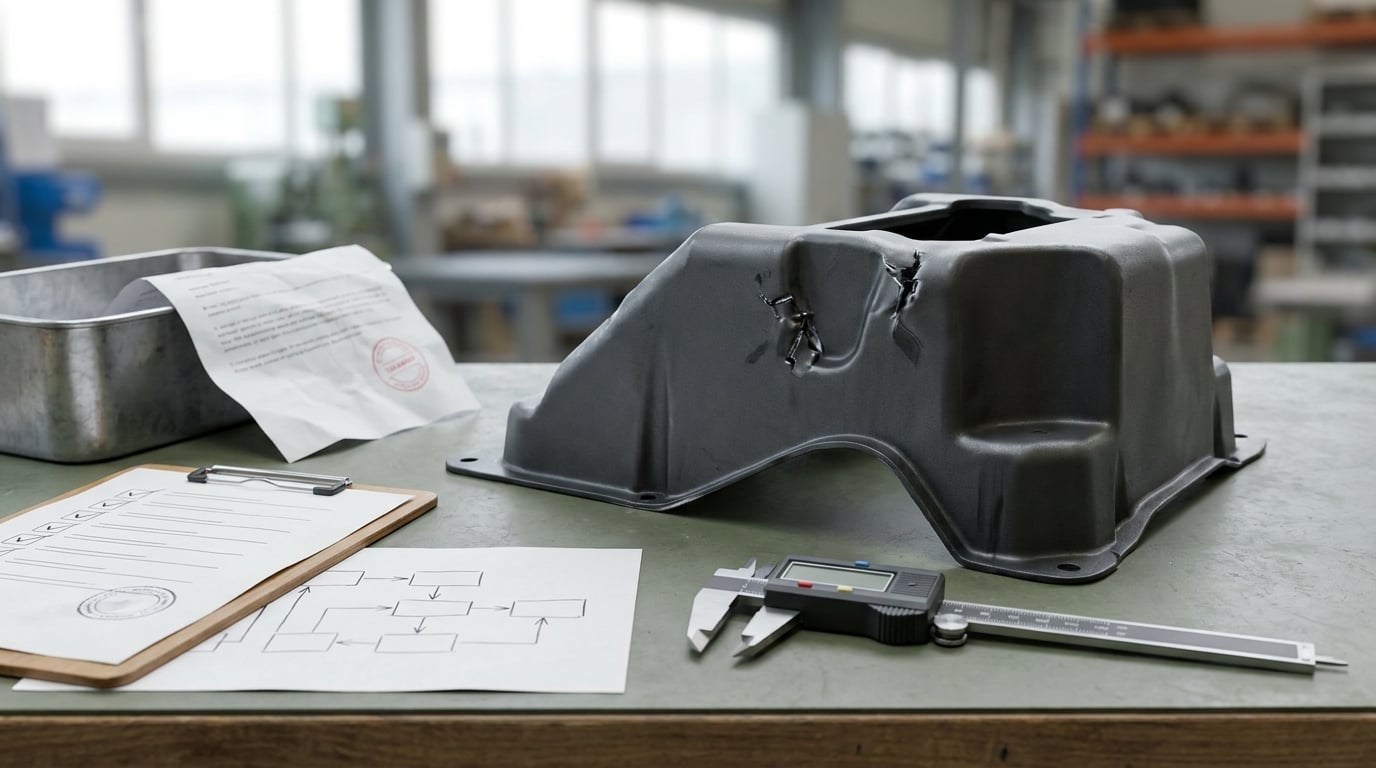
Root cause analysis methods for manufacturing defects are structured ways of tracing a bad part, weld or leak back to the condition that allowed it, so you can change that condition instead of repeating the repair. No single method fits every defect, and the strongest results usually come from pairing two or three of them.
That pairing matters because the hard part of root cause analysis is rarely the diagram. It is knowing which method to pick once you are standing in front of a line that is still running, and knowing when the investigation is finished. This guide walks through the major methods, the defect types each one suits, and the verification step that stops a fix from quietly wearing off.
Written for quality engineers, process engineers, supervisors and reliability teams who already have a defect in front of them and a limited amount of investigation time.
Table of Contents
- What Is Root Cause Analysis in Manufacturing?
- Root Cause Analysis Methods for Manufacturing Defects at a Glance
- How to Choose the Right Root Cause Analysis Method
- 5 Whys: When a Defect Has a Clear Causal Chain
- Fishbone or Ishikawa Diagrams: When Multiple Causes Interact
- Fault Tree Analysis: When Failures Have Several Combinations
- Data and Statistical Methods: When the Defect Is Intermittent
- 5M and Process Audits: How to Check the Manufacturing System
- How to Verify the Root Cause Before Corrective Action
- How to Turn Root Causes into Corrective Actions
- Common Mistakes in Manufacturing Root Cause Analysis
- Frequently Asked Questions
- When should I use 5 Whys versus a fishbone diagram?
- What is the main difference between FMEA and root cause analysis?
- How many whys should I ask in a 5 Whys analysis?
- What is the difference between root cause and immediate cause?
- How do I investigate an intermittent defect I cannot reproduce?
- Should every manufacturing defect trigger a formal root cause analysis?
- Conclusion: Pick One Defect and One Method
What Is Root Cause Analysis in Manufacturing?
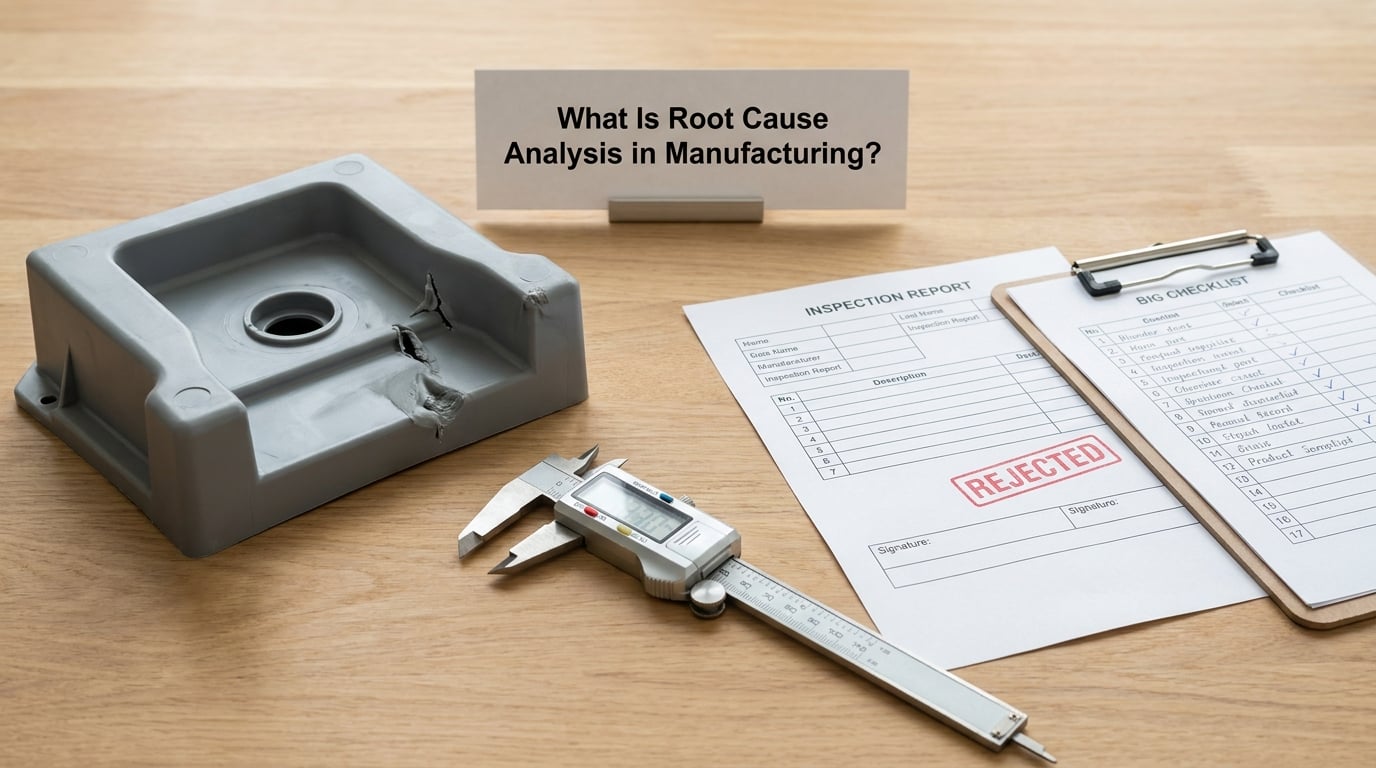
Root cause analysis is a structured problem-solving method that works backwards from an observed defect to the process, machine, material, method, measurement or environment condition that made the defect possible. Fixing the visible symptom restarts the line. Fixing the underlying condition is what stops the defect coming back next week.
The distinction that trips up most investigations is between the cause you can see and the cause that set it up. The weld bead is porous; the porous bead is a symptom. Something upstream decided how much gas, how much wire speed and how much shielding the weld got, and that is where the fix belongs.
Root cause, immediate cause, contributing cause and escape point
Four terms describe different parts of the same event, and quality teams use them precisely:
- Immediate cause is the defect itself, the thing a customer or an inspector sees. A hole 0.4 mm over tolerance, a cap that leaks when squeezed.
- Root cause is the condition you can change and measure. A feeder set 12% low, a coolant concentration drifting, a torque specification written as a range with no action limit.
- Contributing cause is a condition that made the root cause possible or made it worse. A worn die, an undersized dryer, a schedule that pushed the setup.
- Escape point is where the defect got past the control that should have caught it. A gauge in need of calibration, an incoming inspection that sampled three parts from a lot of two thousand.
Run a formal investigation when a defect recurs, when a customer finds it before you did, when the same failure keeps consuming maintenance hours, or when a certification audit requires documented cause for a nonconformity. Skip it for a one-off mishap with an obvious, cheap and already-fixed explanation, and write that reason down instead. Investigation hours are a real cost, and a shop that investigates everything investigates nothing well.
Root Cause Analysis Methods for Manufacturing Defects at a Glance
| Method | Best for | Direction | Complexity | Typical investigation time |
|---|---|---|---|---|
| 5 Whys | A single recurring problem with a traceable chain of events | Backward, causal | Low | 30 to 60 minutes |
| Fishbone or Ishikawa diagram | Causes that could sit in several areas at once | Backward, exploratory | Medium | 2 to 4 hours |
| Is / Is-Not analysis | Narrowing a defect to the specific conditions that produce it | Backward, comparative | Low to medium | 1 to 3 hours |
| Fault tree analysis | Failures produced by combinations of events, with logic gates | Backward, deductive | High | 1 to 3 days |
| Pareto analysis | Deciding which defect deserves investigation first | Backward, statistical | Low | 2 to 4 hours |
| Control charts and capability studies | Intermittent defects and gradual process drift | Backward, statistical | Medium | 4 to 8 hours |
| 5M review and process audit | Systemic escapes, shift handover issues, unclear standards | Backward, observational | Medium | 4 to 8 hours |
| FMEA | Preventing failures that have not happened yet | Forward, proactive | High | Several days |
These times are typical, not promises. A single-cause 5 Whys is often finished inside an hour with the right three people in the room. A full fault tree or a new-process FMEA is a multi-day exercise that needs subject matter experts you may have to schedule a week ahead.
How to Choose the Right Root Cause Analysis Method
Choose the method by asking what you already know about the defect. If you can reproduce the defect on demand and the sequence is traceable, 5 Whys is enough. If the defect could come from any of six areas and nobody is sure, draw the fishbone first and then pick the branches worth a why-chain. If it comes and goes with no pattern you can see, the method is statistical, not conversational.
| Defect pattern | Start with | Then add |
|---|---|---|
| Dimensional, out of tolerance on a known feature | 5 Whys | Capability study on that characteristic |
| Cosmetic, blemishes, flow marks, weld spatter | Fishbone across material, machine, method and environment | Lot and shift trend of defect frequency |
| Functional, leaks, breaks, fails to operate | Fault tree with AND and OR gates | Failure history from maintenance records |
| Intermittent, cannot reproduce on demand | Control chart and special-cause signals | Is / Is-Not on shift, machine and material lot |
| Changeover-related, appears after a schedule change | Management of change review | Fishbone limited to setup and material |
| Recurring across many product types | Pareto to rank defect categories | 5 Whys on the largest category |
Three constraints decide the rest. The first is the data you can actually get: without event timestamps, machine logs or lot traceability, a statistical method will produce a confident wrong answer. The second is the team you can assemble today, since a fishbone built without the operator who runs the machine will miss the causes that only appear at the machine. The third is the timeline, which is what a cost and benefit gate is really about. One benchmark cited in maintenance circles puts the share of corrective actions actually closed within 90 days at roughly a third, even when the analysis itself found a valid cause, so the fastest useful method beats the most thorough one when the line is stopped.
Do not run a formal investigation for every scrap event. A defined floor on what counts as an investigation, such as a repeat nonconformity or a customer escape, keeps the method credible and stops it turning into paperwork.
5 Whys: When a Defect Has a Clear Causal Chain
The 5 Whys method asks why a defect happened, answers with evidence, then asks why that answer is true, repeating until you reach a condition you can change. The name is a prompt, not a quota. Three whys can be correct, and seven is not a failure.
The discipline is in the answers. Each answer must be a fact you can point at: a reading, a record, a setting, a procedure step, a material lot. “The operator was in a hurry” is an opinion about a person, and it ends the investigation before it starts.
A worked why-chain on a seal leak
Illustrative example, a capping line where 6% of units in one four-hour run failed the seal leak test:
- Why did the units leak? Because they failed the automatic seal test.
- Why did the seal test fail? Because capping head 2 ran at roughly 12% below the torque target for most of the run.
- Why was head 2 low on torque? Because the clutch slipped, and the line kept producing without stopping.
- Why did the line keep producing? Because torque was verified with a go or no-go check and no numeric value was recorded, so the drift was invisible.
- Why was the check go or no-go? Because the control plan was written to catch a hard stoppage, not a slow drift, and no one had asked for the trend.
The root cause is the fifth answer: a control plan with no trending requirement. Replacing the clutch would have restored output and left the drift invisible again. The corrective action is to log a numeric torque reading for every head at every changeover, alarm on the low limit, and route the setting change through management of change. Under a proper fix of this kind, seal-test failures on that line typically fall from a few percent to well under one percent, but the number depends entirely on how long the drift was allowed to run.
5 Whys works when the chain is single and linear, when the process is repeatable, and when the people in the room have seen the failure. It fails on a cause that is genuinely several things at once. If you reach “several possible causes” or “one of four things,” stop the chain and switch to a fishbone or a fault tree rather than forcing an answer.
Fishbone or Ishikawa Diagrams: When Multiple Causes Interact
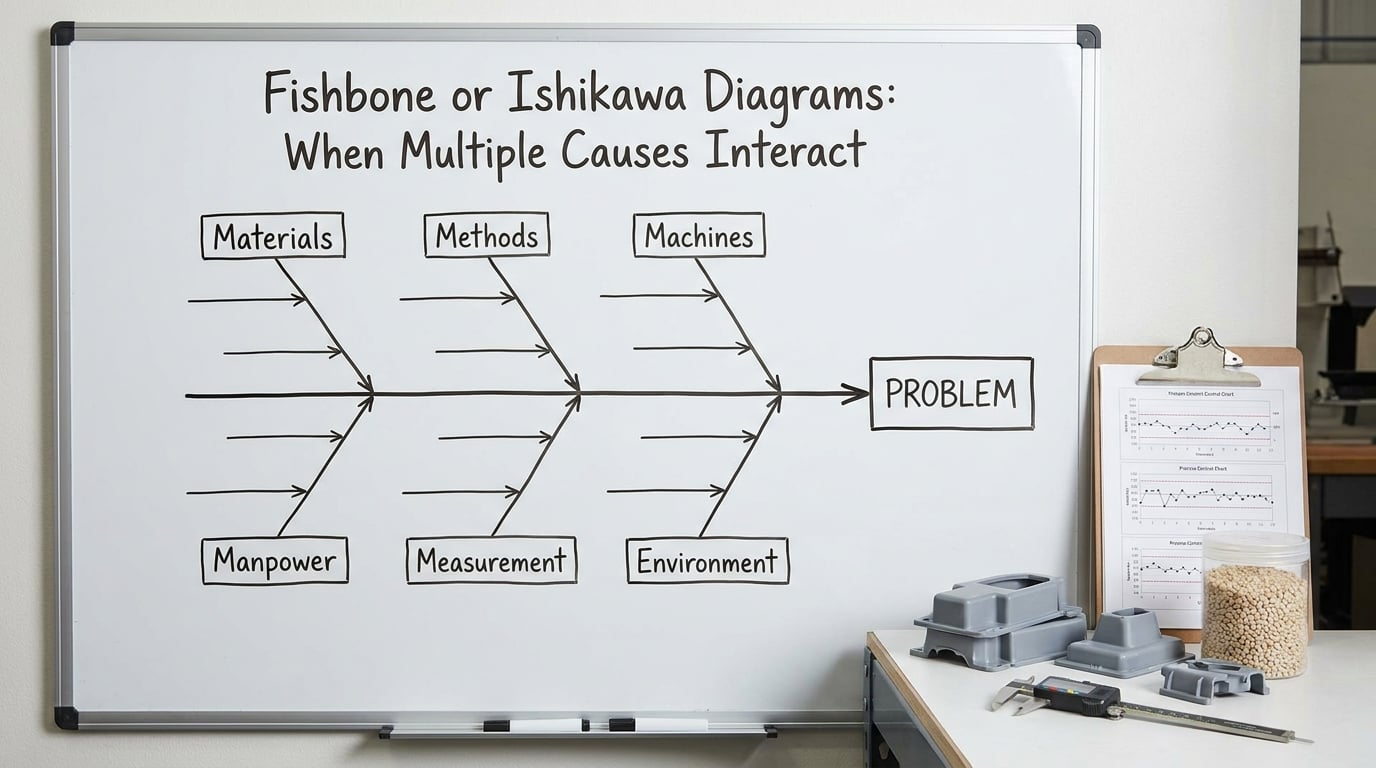
A fishbone diagram, also called an Ishikawa or cause and effect diagram, is a spine with a head that names the defect and branches that collect possible causes. It is the right tool when the cause could sit in any of several areas and nobody in the room has a confident single answer.
Manufacturing teams normally sort causes into six categories, often remembered as 6M: material, machine, method, man, measurement and environment, with mother nature used for natural causes in some plants. Each branch gets one or two lines of specific prompts, not abstract labels. A material branch asks about incoming lot variation, moisture, melt temperature and supplier change; a measurement branch asks whether the gauge is capable, whether it was calibrated, and whether the measurement system itself has been studied.
The diagram generates candidates. It does not rank them. The step that makes it useful is verification: take the three most plausible branches and go look for evidence on the floor, in the records, or in the process data. Practitioners report that building the fishbone with operators, maintenance technicians and process engineers in the same room surfaces causes that a single-discipline review never would have reached.
Keep the first diagram to one page. A fishbone with forty prompts is a brainstorming session, and the useful branches are usually the five that the gemba walk confirms within the hour.
Fault Tree Analysis: When Failures Have Several Combinations
Fault tree analysis is a top-down deductive method that starts with one defined failure at the top and breaks it into the events that could produce it, connected by logic gates. An AND gate means every input must occur for the top event to happen; an OR gate means any one input is enough. That is the whole difference between a fault tree and a fishbone: a fishbone collects candidate causes in any order, while a fault tree asks what combination of causes is required.
The value shows up on defects with two or three independent conditions. A leak on a sealed assembly might need both an out-of-tolerance groove and a torque below the low limit; a tree makes that requirement visible, and it lets you add probabilities or frequencies to the inputs so you can see which branch carries the risk.
A full fault tree on a complex process is a multi-day job and needs people who know the process design, not just the operators. For a routine line defect, a simplified two-level tree drawn on paper often answers the question in under an hour.
Data and Statistical Methods: When the Defect Is Intermittent
When a defect appears twice a month, no amount of conversation will find it. Statistical methods work on recorded data instead of on memory, and they separate the two conditions that get confused on the floor: common cause variation, the everyday spread of a stable process, and special cause variation, the signal that something specific changed.
The tools worth knowing, in order of how often they get used:
- Control chart. Plot the characteristic over time and look for signals: a point beyond the limits, a run of seven on one side of the centre line, a trend. Any of these means a special cause is present and something changed on a date you can identify.
- Process capability, Cp and Cpk. Compare the process spread with the specification width. A capable-looking average can still be incapable if the process is drifting, and capability before and after a corrective action is the cleanest evidence that the fix worked.
- Pareto analysis. Rank defect categories by frequency or cost, then look for the vital few. This is also the best tool for deciding what to investigate first, which is a use most teams never think of.
- Correlation and regression. Useful when a suspected driver is continuous, such as ambient temperature against a dimensional drift, provided the correlation is strong and the mechanism is plausible. Correlation alone is not a cause.
- Time series pattern checks. Shift, day of week, hour, machine, material lot and operator are all dimensions worth splitting the data by before concluding anything.
One warning from the floor: reason codes and downtime entries are often typed under production pressure, which means a Pareto chart can be a picture of operator assumptions rather than of observed causes. Check the source data quality before you build a chart on it, and fix the data capture first when it is guesswork.
5M and Process Audits: How to Check the Manufacturing System
A 5M review walks through man, machine, material, method and measurement and asks the same questions in each area: what was supposed to happen, what actually happened, and how would anyone know the difference? It is used most often for escapes, where a defect got through because a control did not work rather than because a process made the defect.
The audit works only when each observation is tied to objective evidence. Noticing that the second shift sets up machines differently is an observation; finding that the setup sheet is only signed off on first shift, that the tolerance was widened in a change note three months ago, and that the gauge used to check it has been out of calibration for six weeks, is an audit. The first gives you a conversation, the second gives you a corrective action.
A gemba walk, the practice of going to the machine and watching the actual work, is the fastest way to generate the evidence. What you see rarely matches what the procedure says, and the gap between the two is usually the escape point.
How to Verify the Root Cause Before Corrective Action
A root cause is not proven because a team agreed on it. It is proven when you can show that removing it removes the defect. Before you spend money on a permanent fix, run this checklist:
- Contain first. Quarantine the affected material and stop the line or the shipment, then say so in writing.
- Check the measurement system. Confirm the gauge can tell good from bad at this tolerance. A study of measurement capability before chasing a process cause saves weeks.
- Test the cause directly. Put the process back the way it was and reproduce the defect, then set it to the suspected condition and see the defect disappear. If you cannot reproduce the defect even once, your cause is a theory.
- Change one thing. Trial one variable at a time. Two changes and a clean result tells you nothing about which one worked.
- Set acceptance criteria before the trial. Decide what number counts as success, for how long, before you look at the data.
- Document the trial result. The trial is the evidence that the cause was real, and it belongs in the report whether it passed or failed.
If the trial fails, the cause was wrong or incomplete. Go back to the diagram rather than stacking another fix on top, because two unverified fixes produce a defect nobody can explain later.
How to Turn Root Causes into Corrective Actions
Not every corrective action is the same kind, and mixing them up is why a fault sometimes comes back. The clearest way to separate them is by how far the fix reaches.
- Corrective action removes the specific cause of this occurrence. Change the feeder setting, replace the worn insert, revise the work instruction.
- Preventive action stops the same cause from producing a different defect later. Add a check to the control plan, add the condition to the preventive maintenance schedule.
- Systemic corrective action changes the system that let the cause exist. Add a management of change sign-off, add a torque trending requirement, add error proofing so a wrong setting cannot be made.
Across molding, assembly, packaging and logistics the systemic actions look similar: error proofing at the station, a numeric record instead of a visual check, a specification with action limits instead of a target, a change control step that a supervisor has to sign. The best outcome in a plant is usually the one that makes the mistake physically difficult rather than the one that explains it better.
Every nonconformity raised under ISO 9001 or ISO 13485 needs documented cause analysis behind its corrective action, and the same documentation usually feeds the 8D report a customer asks for. Track the actions as real work orders or process revisions with owners and dates. An analysis that ends in a meeting produces a good document and no change on the line.
Close the loop with a verification period. Watch the defect rate for long enough to see the original pattern return or stay gone, and record the result on the same report.
Common Mistakes in Manufacturing Root Cause Analysis
- Stopping one why too early. “Operator error” is where investigations go to die. Ask what about the setup, the fixture, the standard or the workload made the error likely, and keep going until the answer is something you can measure.
- Assuming a single root cause. Complex defects usually have a root cause plus contributors. The contributing conditions are where the fix has to go too.
- Changing several variables at once. The line looks better and nobody knows why, so the next recurrence gets fixed with the same guess.
- Ignoring the measurement system. Chasing a process that was never out of tolerance wastes a week and damages trust in the whole process.
- Building the case on opinion. A why-chain with no data behind it is a story, and stories do not survive an audit or a repeat failure.
- Declaring success without monitoring. If the process has not been watched over a full production cycle, the corrective action is unproven.
- Running the session as a blame exercise. The moment people believe the meeting is about who, you lose the observations from the people closest to the work, and the fault comes back.
One safeguard helps with most of these: have someone whose job it is to challenge the analysis play the devil’s advocate. Practitioners on quality forums describe operator error as an investigation that stopped one why too early, and the fastest way to catch that is a dedicated question at the end of the session.
Frequently Asked Questions
When should I use 5 Whys versus a fishbone diagram?
Use 5 Whys when the defect has one traceable chain and you can reproduce it: the failure has a start, a sequence and a stop, and the same people are available to answer why. Use a fishbone when the cause could sit in material, machine, method, people, measurement or environment, especially when nobody has a confident single answer. The two combine well: fishbone to generate candidates, then a why-chain on the branch that evidence confirms.
What is the main difference between FMEA and root cause analysis?
Root cause analysis is backward-looking and reactive: a defect has already happened and you are working out why. FMEA is forward-looking and proactive: you build a structured list of how a process could fail, score each failure mode for severity, occurrence and detectability, and act before the defect ever appears. Many plants run FMEA on a process after an RCA, to stop the same failure mode reaching a customer next time.
How many whys should I ask in a 5 Whys analysis?
As many as it takes to reach a cause you can measure and change, which is often three and sometimes seven. The number five is a prompt, not a quota. The test is the last answer: if it is a setting, a tolerance, a procedure step or a material property, you have a root cause. If it is still an intention, an attitude or a general statement about people, keep asking.
What is the difference between root cause and immediate cause?
The immediate cause is the defect itself, the thing an inspector or customer sees, such as a hole that is out of tolerance. The root cause is the upstream condition you can change, such as a worn tool or a drifting temperature setting. Correcting the immediate cause removes this part; correcting the root cause is what prevents the same parts from being made next week.
How do I investigate an intermittent defect I cannot reproduce?
Stop relying on the people who remember the failure and start using recorded data. Put the characteristic on a control chart to look for special cause signals, split defect counts by shift, machine, hour and material lot, and use Is and Is-Not analysis to compare the conditions when it happened with the conditions when it did not. Fix the data capture first if reason codes are being guessed under production pressure.
Should every manufacturing defect trigger a formal root cause analysis?
No, and plants that try to do this end up investigating everything badly. Set a threshold first, such as a repeat nonconformity, a customer escape, a safety or regulatory issue, or a failure that keeps consuming maintenance hours. Below that threshold, record the defect, correct it and move on. A written threshold keeps the method credible and protects the investigation time you have when a real problem appears.
Conclusion: Pick One Defect and One Method
The fastest useful improvement here is a single investigation done properly this week. Take the defect your line is most tired of, decide whether its cause is known, repeatable or still a guess, and pick the method that matches: 5 Whys for a chain, a fishbone for scattered causes, a fault tree for combinations, statistics for anything intermittent.
Then do the part teams skip. Prove the cause with a trial, correct the system that allowed it rather than the part that failed, and watch the data long enough to know the fix held. That habit, repeated, is worth more than any single method on this page.