
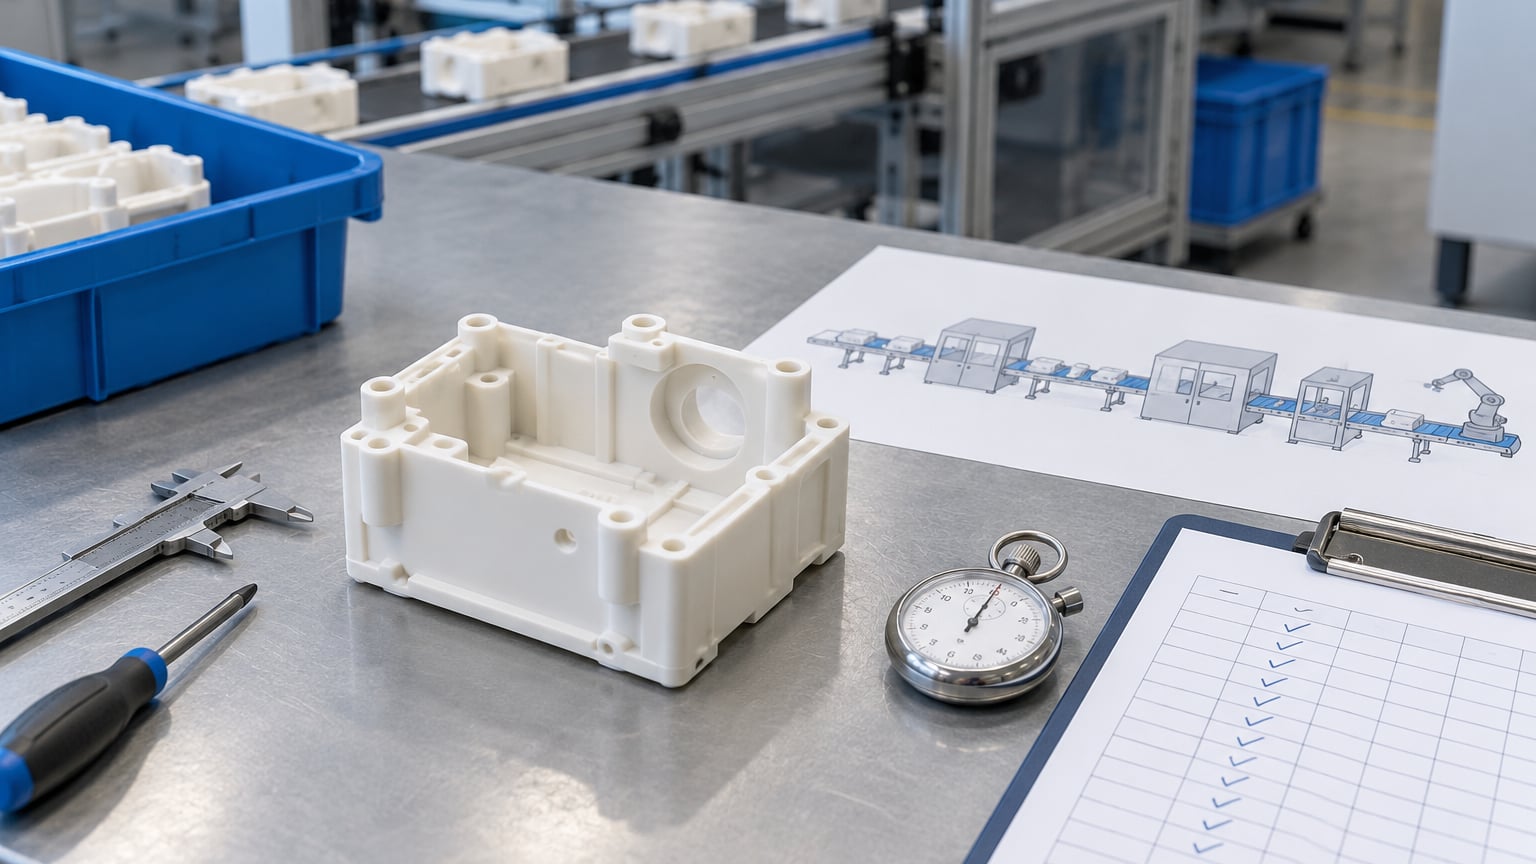
Production throughput is the rate at which an operation completes good, sellable units over a fixed period of time, and you calculate it by dividing good units produced by production time. Pick a time window first (an hour, a shift, a day), count only units that come off the line in saleable condition, and divide. Scrap and anything sent back for rework stay out of the numerator.
It is a five-minute calculation once you have the numbers, but the choice of window and the definition of a good unit decide whether the result means anything. Get those two wrong and you will report a rate that no one can plan against.
Table of Contents
What You Need
Most plants already hold every number this calculation requires. It is rarely in one place, though, which is where most errors come from.
- A fixed time window. Hour, shift or day. Pick one and write it on the report so two shifts are not compared against one.
- Gross units produced in that window, counted at the last station of the line.
- Scrap and rework counts for the same window, so good units can be derived rather than guessed.
- Cycle time in seconds per part, ideally from a timed run rather than a nameplate number.
- Downtime log covering planned stops, breakdowns, material shortages and changeovers.
- Staffing record for the window: how many operators, on which stations, for how many hours.
- Where the numbers come from: an MES if you run one, an ERP if the line reports there, otherwise the paper shift report or a shared spreadsheet.
The last point matters more than people expect. A method that works with a clipboard and a shift sheet gets used; a method that needs a purchased system gets skipped for six months.
Related: if you are converting a rate into cost per part later, how to calculate machine hour rate picks up where this leaves off.
How to Calculate Production Throughput from Line Data
Production throughput is the number of good units a line, machine or plant completes in a given period, expressed as units per hour, per shift or per day. The calculation is a division: you count the saleable output over a window you define in advance, then divide by the length of that window.
Here is the whole formula:
Throughput = Good Units Produced / Production Time
Everything else in this guide is about filling those two blanks correctly. The numerator is the harder half, because a unit only counts if it passed inspection and did not go back for rework.
Throughput rate and throughput time are two different metrics
Throughput rate is units per unit of time (units per hour). Throughput time is elapsed time from order or release to completion, also called lead time or flow time. The first answers “how fast do we make parts”, the second answers “how long does an order take”. Teams that report one number and call it throughput end up comparing incomparable things.
| Metric | What it measures | Unit | Direction |
|---|---|---|---|
| Throughput rate | Good output per period | units per hour | Higher is better |
| Throughput time | Elapsed time from release to finished | hours or days | Lower is better |
| Cycle time | Time to produce one unit | seconds per unit | Lower is better |
| Takt time | Time available per unit to meet demand | seconds per unit | Set by demand |
| Lead time | Order placed to customer received | days | Lower is better |
| Production volume | Total units made, good and bad | units | Neutral |
| Capacity | Maximum possible output at full run | units per hour | Ceiling, not a result |
Output and throughput differ in exactly one respect: output counts everything that left the line, throughput counts only what a customer could buy. Capacity is the ceiling you could hit under ideal conditions, so throughput sits below it whenever anything goes wrong.
Step-by-Step
Six steps, in this order. Skipping step two is what turns a real number into a fiction.
- Set the production boundary. Decide exactly which machine, line or plant you are measuring, and where the count starts and stops. For a line, the count belongs at the last station before the buffer.
- Fix the time window. Hour, shift or day, written down. Use the same window every time so the trend line means something.
- Count gross units produced over that window from the machine counter or the operator count.
- Subtract scrap and rework. Good units = gross units minus scrapped units minus units sent back for rework. If a unit is reworked and then passes, count it in the window it finally passed, not the window it first ran.
- Divide good units by the length of the window in hours. That is your throughput rate.
- Sanity-check against capacity. The result should sit below the theoretical maximum. If it does not, your window or your count is wrong.
How to Calculate Production Throughput with Cycle Time
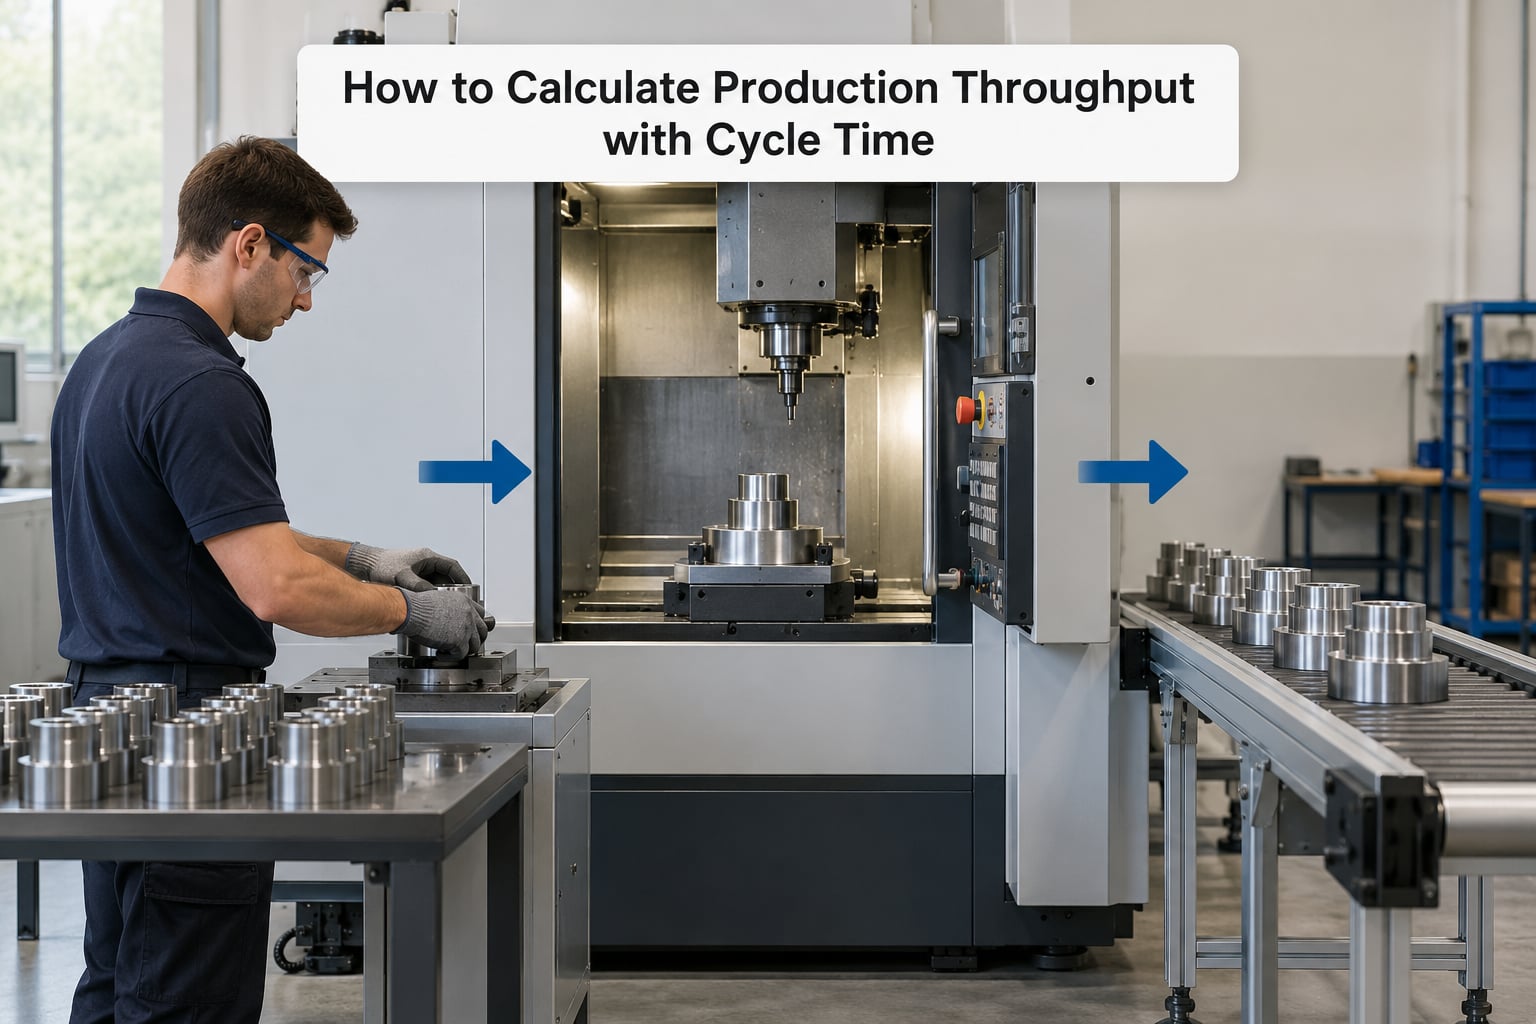
When you know cycle time, you can work backwards from a theoretical rate instead of counting parts one at a time. The relationship is simple: the number of seconds in your window divided by the cycle time in seconds gives the theoretical units per window.
Theoretical rate = (seconds in window) / (cycle time in seconds)
Worked example, an injection molding machine producing a 24 second housing part on an eight hour shift:
- Seconds in an eight hour shift: 8 x 60 x 60 = 28,800 seconds
- Theoretical rate: 28,800 / 24 = 1,200 parts per shift
- Theoretical rate per hour: 3,600 / 24 = 150 parts per hour
Same math on an assembly line: an operator assembling one unit every 55 seconds over 480 minutes gives 28,800 / 55 = 523 units, which you would report as about 65 units per hour.
Cycle time is often the quickest first estimate, but it is a capacity figure, not a throughput figure. It assumes the machine runs every second of the shift with zero defects, and no line does that.
How to Account for Uptime, Scrap, and Changeovers
Once you have the theoretical rate, adjust it downward for the four things that actually eat output: downtime, changeovers, quality losses and staffing gaps.
Planned downtime. Scheduled breaks count as time in the window even though the line is not producing. Either exclude them from the window or divide by net available hours. Pick one convention and keep it.
Unplanned downtime. Add every breakdown from the downtime log, then work out the resulting availability. A machine that runs 6 hours of an 8 hour shift on average is at 75 percent availability, whatever the nameplate says. If you do not track MTBF and MTR, you are guessing at this number, and how to calculate MTBF and MTTR for manufacturing equipment covers how to get it from the log.
Changeovers. Decide whether changeover sits inside your window. If it does, the line rate you report will dip every time you switch products, which is the honest picture. If it does not, exclude the setup hours from the window too, and say so on the report. Mixing the two is a common source of arguments between production and finance.
Scrap and rework. Multiply by first pass yield, or subtract rejects outright. On a run of 1,200 parts with 36 scrapped, good units are 1,164 and throughput is 145.5 per hour rather than 150.
Staffing coverage. A line designed for two operators running with one will lose more than 25 percent. Count the hours each station was actually manned.
| Factor | Line example | Adjustment |
|---|---|---|
| Theoretical rate | 150 parts per hour | Starting point |
| Planned downtime | 30 min break, 7.5 net hours | Window becomes 7.5 h |
| Unplanned downtime | 90 min breakdowns | 6.0 net hours |
| Changeover | 45 min included in window | 5.25 net hours |
| Scrap | 36 of 1,200 rejected | Good units only |
| Effective throughput | 1,020 good units in 5.25 h | 194 units per hour |
That final number is roughly 1,200 parts of potential becoming about 1,020 saleable units, and the gap is the improvement opportunity. If your line uses OEE, availability, performance and quality are the same three factors written as a percentage, and throughput rate remains the result in units.
How to Use Throughput to Plan Staffing and Capacity
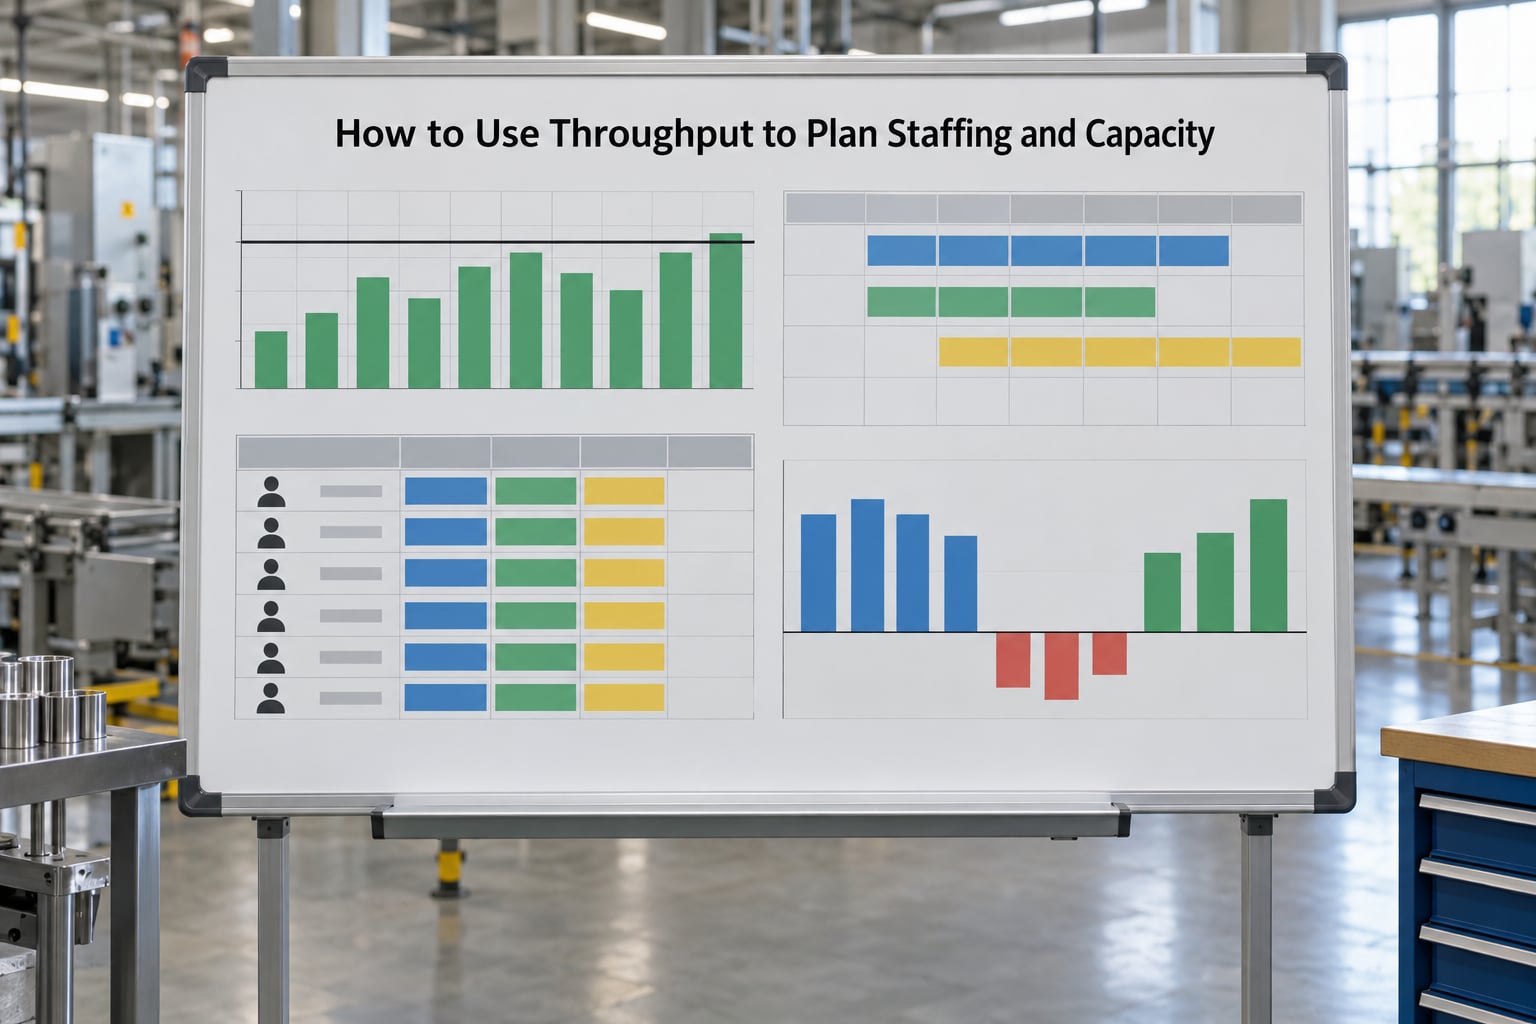
A throughput number only earns its place when it changes a decision. Once the rate is verified, three conversions do most of that work: rate to shift output, shift output to labour hours, and rate to capacity gap.
Rate to shift output. Multiply units per hour by net available hours. At 194 units per hour over 7.5 hours, the shift plan is about 1,455 units.
Shift output to labour hours. Divide shift output by the units each operator completes per hour. If each operator finishes 65 units per hour, 1,455 units needs 22.4 operator hours, or three operators across an 8 hour shift with a little slack for breaks and handover.
Rate to capacity gap. Compare verified throughput against what demand requires. A customer order book needing 1,700 units a shift against a line that verifiably does 1,455 leaves a 245 unit gap, and the answer is capacity, overtime, a second shift or another line, not a target on a whiteboard.
Across multiple lines or shifts, weight each line by the hours it actually ran rather than averaging the percentages. Total good units across all lines divided by total production hours across all lines gives a plant rate that reflects reality.
The same method works outside the plant. In a distribution centre, warehouse throughput is units picked, packed and shipped per hour, over a defined window, counted at despatch rather than at the pick face. Divide lines shipped by hours staffed. For fixed consumption that scales with volume, how to calculate factory energy cost per part takes the rate you just verified and turns it into a per-unit figure.
Common Mistakes
| Mistake | Correction |
|---|---|
| Counting scrap as output | Subtract rejects and rework from gross units |
| Changing the time window between reports | Fix one window and hold it for comparison |
| Mixing seconds, minutes and hours in one formula | Convert to a single unit before dividing |
| Including changeover but excluding breaks | State the convention on every report |
| Averaging line rates instead of weighting by hours | Sum units, sum hours, then divide |
| Using nameplate cycle time as the rate | Time a real run with a stopwatch |
| Comparing a rate against a time | Report rate and time as separate metrics |
| Overwriting the number when a shift goes badly | Record reality; trend the cause later |
Before you publish a throughput number, run this check: is the window stated, is the boundary stated, are scrap and rework excluded, are the hours net of the stops you claim, and is the result below the theoretical maximum? If any answer is no, the number is not ready for a report.
There is also a second route to the same answer. Little’s Law states that throughput equals work in process divided by cycle time, so a cell holding 480 units with a 40 second average cycle time is running at 12 units per minute. It is useful as a cross-check against your counted number, and it needs far less data.
Frequently Asked Questions
What is production throughput?
Production throughput is the rate at which an operation completes good, sellable units over a fixed period, expressed as units per hour, shift or day. It is calculated as good units produced divided by production time. Only units that pass inspection count, so scrap and anything sent back for rework are excluded from the count.
How do I calculate throughput from cycle time?
Divide the seconds in your time window by the cycle time in seconds. For an eight hour shift of 28,800 seconds and a 24 second cycle time, the theoretical rate is 1,200 parts per shift, or 150 per hour. That figure is capacity, not throughput, so adjust it for downtime, changeovers and scrap before you use it for planning.
Should production throughput use OEE?
Not as the headline number. OEE multiplies availability, performance and quality into a percentage, which is useful for diagnosing losses. Throughput rate stays in real units, such as 194 units per hour, because that is the figure planners and schedulers can actually work with. Use OEE to explain the gap between capacity and the achieved rate.
How do I calculate throughput for a multi-operator assembly line?
Count good finished units at the end of the line over a fixed window, then divide by the hours the line ran. For staffing, divide the shift target by the units each operator completes per hour to get operator hours needed. The line rate is set by the slowest station, so measure that station’s cycle time before assuming the whole line can go faster.
What is the difference between throughput and production capacity?
Capacity is the ceiling the equipment could hit running perfectly, based on cycle time and available hours. Throughput is what the line actually delivered as good units in the window you measured. Throughput always sits at or below capacity, and the difference is your downtime, changeovers, scrap and staffing losses, which is exactly where improvement work should start.
How do I set a realistic daily production target?
Base it on verified throughput, not on capacity. Take your counted good units per hour over the last several stable shifts, multiply by net available hours and by the number of shifts you actually plan to run. Add a small buffer of three to five percent for normal variation. A target above verified throughput becomes a daily argument rather than a plan.
Conclusion: Start With a Verified Rate
Count good units over one real shift and divide by the hours the line actually ran. That single verified rate is worth more than a month of targets, because it is the only number every other manufacturing calculation depends on.
Once you have it, turn it into cost with the machine hour rate guide, split it into variable consumption using the energy cost per part method, and back the availability assumptions with real MTBF and MTTR data rather than a nameplate figure.