
The manufacturing overhead rate is your total indirect production costs divided by the allocation base you choose to measure activity in. Dividing the cost pool by direct labor hours, machine hours, or units produced gives you a rate per hour or per unit, and multiplying that rate by actual activity tells you what overhead a job really consumed.
This guide walks through how to calculate overhead rate in manufacturing in seven steps, from setting cost centers to reconciling the rate against actual spending at year end. It also covers which indirect costs belong in the pool, which stay outside it, and how to pick a denominator that does not distort your product costs.
The whole exercise takes an experienced cost accountant two to three days the first time, mostly spent classifying accounts. Once the pool structure exists, refreshing the numbers each quarter is a few hours in a spreadsheet. What follows is the method, the worked numbers, and the checks that catch a bad rate before it reaches a quote.
Table of Contents
- What You Need to Calculate Overhead Rate in Manufacturing
- Step-by-Step
- Step 1 — Define the Cost Centers and Reporting Period
- Step 2 — Gather and Classify Manufacturing Overhead
- Step 3 — Normalize the Cost Pool
- Step 4 — Select the Allocation Base and Denominator
- Step 5 — Calculate Overhead Rate in Manufacturing
- Step 6 — Apply the Rate to Products or Cost Centers
- Step 7 — Validate, Document, and Update the Rate
- Common Mistakes
- Frequently Asked Questions
- What is the difference between a predetermined overhead rate and an actual overhead rate?
- Should manufacturing overhead be allocated using units produced or machine hours?
- Is factory depreciation part of manufacturing overhead?
- How do you calculate overhead per unit when production volume changes?
- Should a small manufacturer use a plantwide rate or department-level rates?
- Conclusion
What You Need to Calculate Overhead Rate in Manufacturing
Before you touch a formula, gather six things. Without them, any rate you compute is a guess with decimal places.
- Accounting period. A month, quarter, or fiscal year. Most plants set an annual predetermined rate and refresh it, rather than recalculating constantly.
- Cost-center data. General ledger accounts tagged to production departments, not to corporate or sales functions.
- Approved indirect-cost pools. A written list of which account numbers are in scope, signed off by whoever owns the numbers.
- Allocation drivers. A reason for why each pool is caused by the activity you plan to measure. Causality matters more than convenience.
- Production denominator. Total expected direct labor hours, machine hours, or units for the period, taken from the production plan rather than from last year’s actuals.
- Reporting requirements. Whether inventory is valued under absorption costing, and who audits the calculation later.
Have the production plan in front of you when you build the denominator. Using last year’s hours when output has grown understates the rate; using a peak month inflates it and quietly depresses product costs for the rest of the year.
Step-by-Step
Step 1 — Define the Cost Centers and Reporting Period
Decide what is inside the boundary before you collect anything. A typical plastic parts plant might have three cost centers: molding, assembly and packaging, and facilities. Each one gets its own pool and, later, its own rate.
Write down the period and the organizational boundary in one sentence, for example: “Injection molding and assembly costs incurred inside Building C between January and December 2026.” That sentence alone prevents most arguments later, because the alternative is a rate built from a ledger nobody has reconciled.
Step 2 — Gather and Classify Manufacturing Overhead
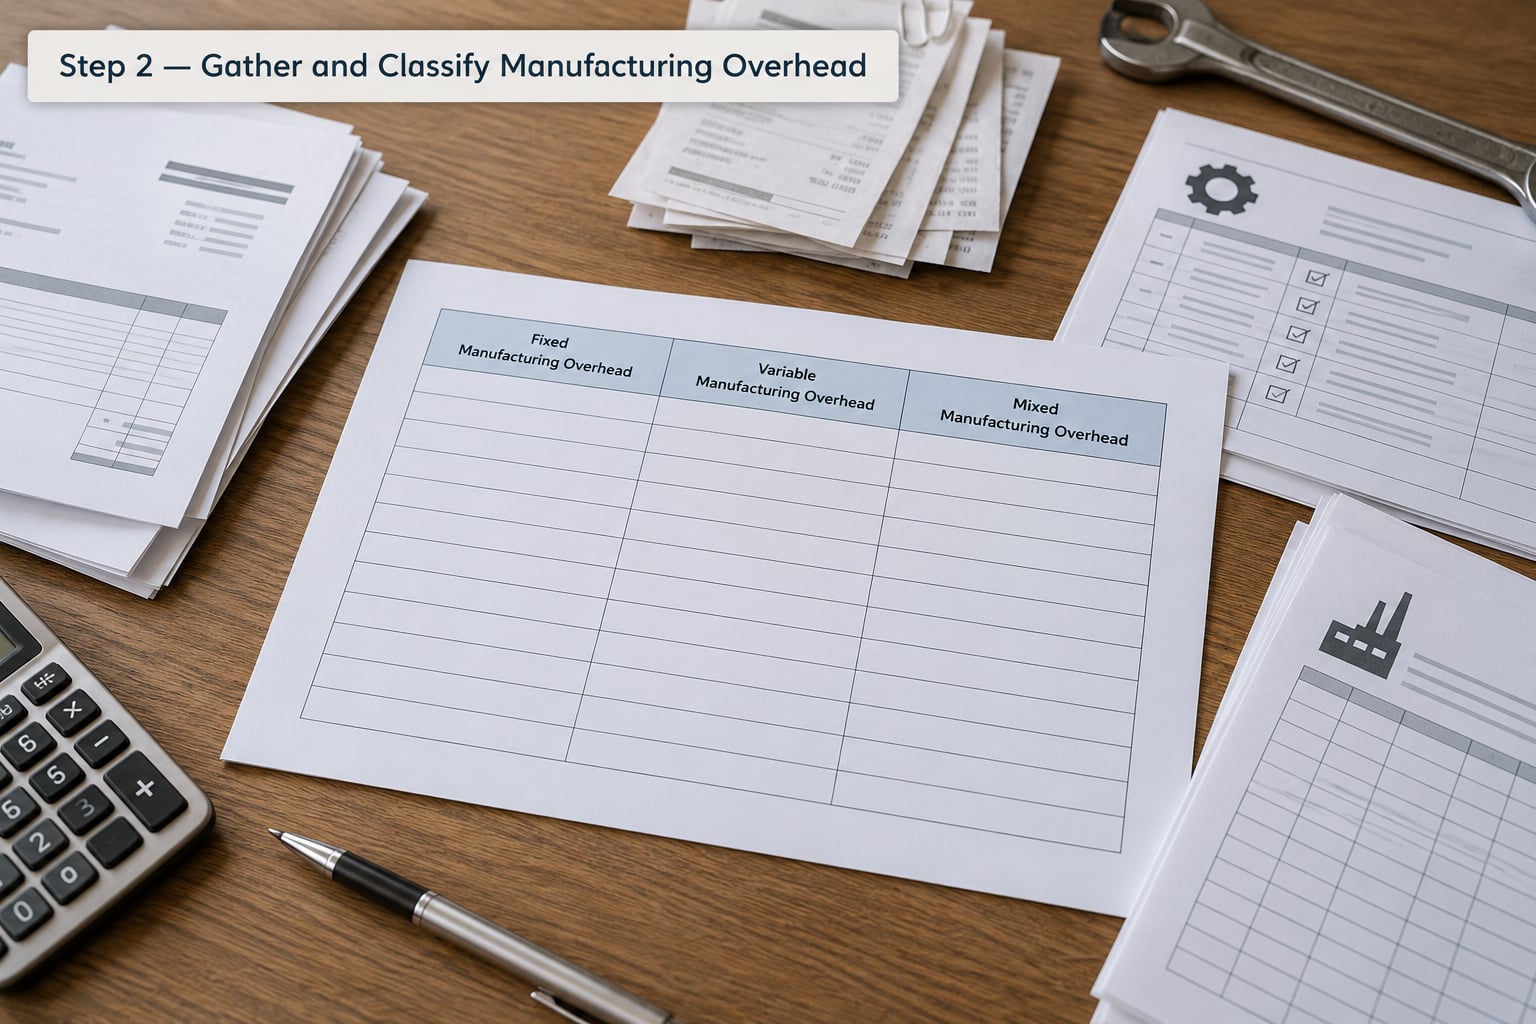
Pull every account that touches production and sort each one into fixed, variable, or mixed. Indirect labor covers supervisors, maintenance techs, and quality inspectors. Indirect materials covers lubricants, gloves, cleaning supplies, and small tools consumed rather than installed.
Utilities, equipment and building depreciation, factory rent, property tax, insurance, and maintenance contracts complete most pools. Each category behaves differently as volume changes, and the classification drives how you treat unused capacity later.
| Cost category | Behavior | Typical example |
|---|---|---|
| Indirect labor | Fixed or semi-variable | Shift supervisors, quality technicians |
| Indirect materials | Variable | Lubricant, coolant, small tools |
| Utilities | Semi-variable | Electricity, gas, water, compressed air |
| Depreciation | Fixed | Presses, molds, building improvements |
| Facility | Fixed | Factory rent, property tax, insurance |
Keep selling, administrative, marketing, interest, and research costs out of it. Those are period expenses, and putting them in the pool pushes value into inventory that never left the building. If a cost serves both production and the front office, split it by a defensible driver such as headcount or floor area rather than guessing.
Utilities deserve a closer look than most people give them, especially the electricity line. Our guide to factory energy cost per part covers how to isolate the machine portion from the lighting and heating portion.
Step 3 — Normalize the Cost Pool
Budgeted cost is not the same as cost your plant will actually absorb. Before dividing, remove items that will not recur or that belong to a different period: a one-time press rebuild, a mold transfer, a regulatory fine assessed once, or an insurance settlement for last year’s claim.
Then handle unused capacity, which is where most published guides go quiet. If the plant runs at 80 percent of practical capacity, roughly a fifth of your fixed overhead is not caused by the jobs you are costing. Two approaches are common: spread fixed overhead over normal capacity in the rate and treat unused capacity as a period charge, or keep the rate at maximum capacity and let idle time absorb the difference. Pick one, write down why, and stay consistent.
The core pattern is stable across most job shops: divide estimated overhead by an estimated allocation base, then apply the resulting rate to the actual activity each job consumed. The estimate step is where discipline matters.
Step 4 — Select the Allocation Base and Denominator
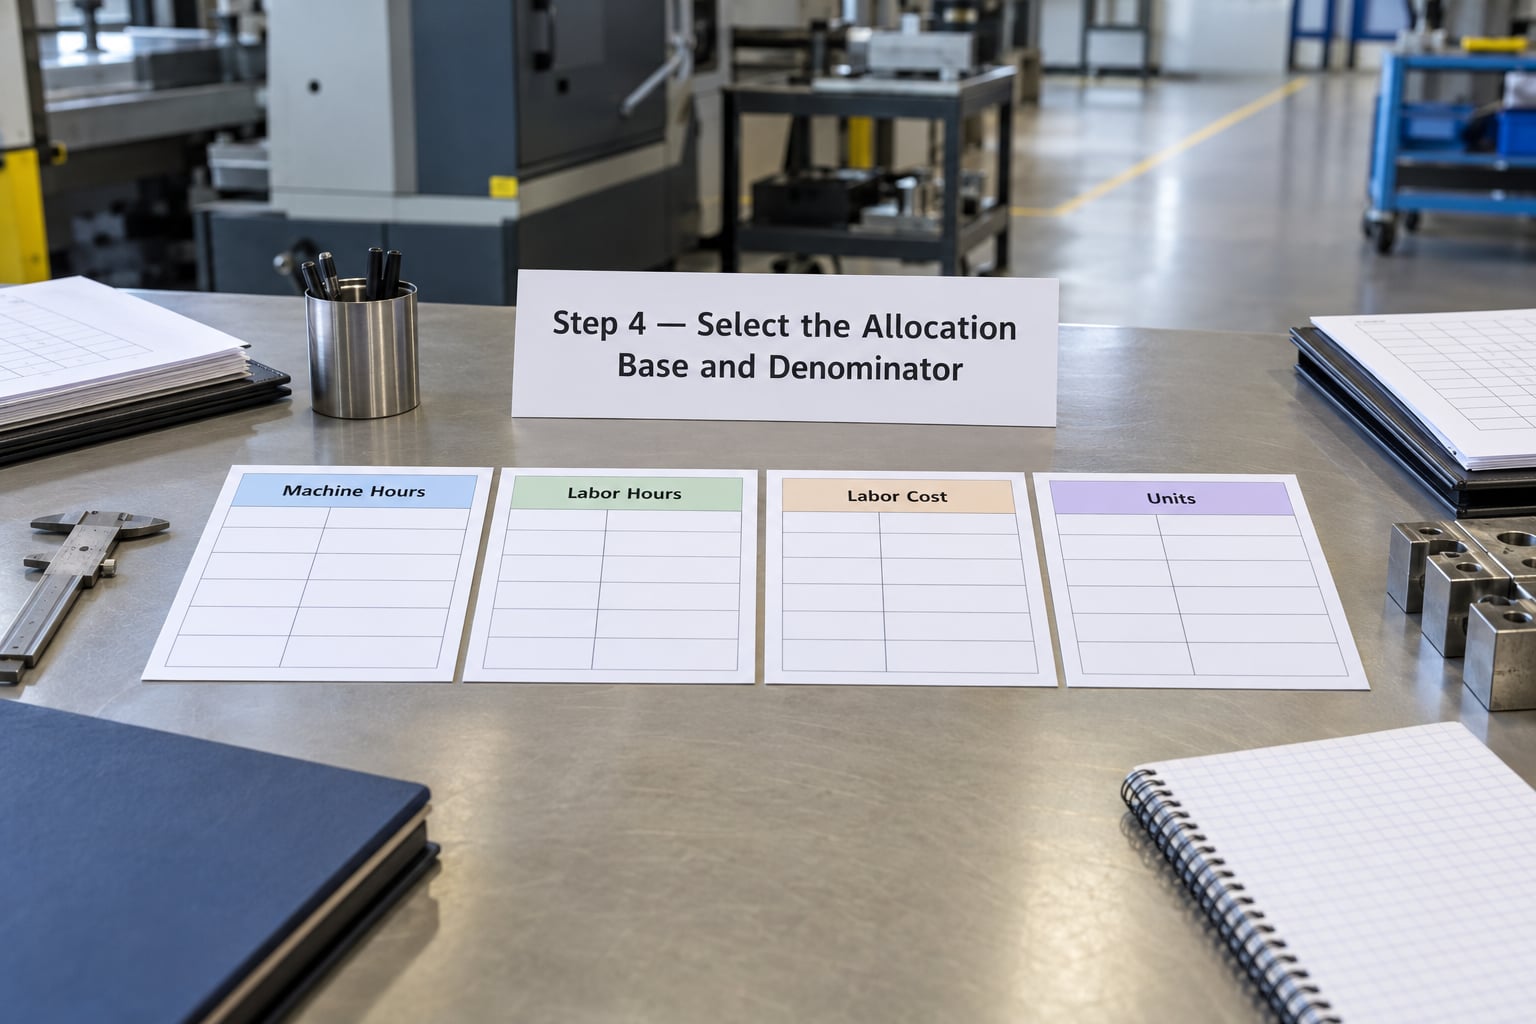
The allocation base should be the unit of activity that caused the cost, not the one that is easiest to pull from the system. A CNC department running lights-out with two operators per shift is driven by spindle hours, while a hand assembly line full of people is driven by labor hours.
| Base | Fits when | Watch out for |
|---|---|---|
| Direct labor hours | Labor content drives the cost and labor is measurable by time clock | Breaks down in automated cells where hours fall while overhead climbs |
| Machine hours | Equipment is the cost driver and labor content is low | Needs accurate machine logs from the control system |
| Direct labor cost | Skill premiums vary widely between shifts or crews | Distorts output when wage rates are negotiated upward |
| Units produced | Few products, similar cycle times, simple operation | Meaningless across parts with wildly different cycle times |
| Activity drivers (ABC) | Several distinct cost pools, setups, inspections, material moves | More data to maintain and to explain |
Mechanized operations are the usual case for tracking machine hours rather than labor expense, precisely because labor content no longer moves with the workload. If your machine logs are rough, our walkthrough on how to calculate machine hour rate shows how to build a defensible number from cycle data.
Step 5 — Calculate Overhead Rate in Manufacturing
The formula is one line: manufacturing overhead rate equals estimated total manufacturing overhead divided by the estimated total allocation base. A predetermined rate uses budgeted figures from before the period; an actual rate divides the real costs incurred by the real activity used, and is only knowable once the period closes.
For a plantwide rate, take the pool across every cost center. Here is a worked plastic parts plant for one year:
| Cost pool | Annual amount | Behavior |
|---|---|---|
| Indirect labor (supervisors, QC, maintenance) | 214,000 | Fixed |
| Factory utilities | 168,000 | Semi-variable |
| Equipment and building depreciation | 132,000 | Fixed |
| Factory rent and property tax | 96,000 | Fixed |
| Indirect materials | 58,000 | Variable |
| Insurance and maintenance contracts | 42,000 | Fixed |
| Total manufacturing overhead | 710,000 |
Expected machine hours for the year are 12,400, so the plantwide manufacturing overhead rate is 710,000 divided by 12,400, or 57.26 per machine hour. If instead you budgeted 14,500 direct labor hours, the rate becomes 48.97 per direct labor hour. Same pool, two denominators, two different product costs, which is why Step 4 is the step people argue about.
Department rates sharpen this further. Molding carries 452,000 of pool over 9,600 machine hours, giving 47.08 per machine hour. Assembly and packaging carries 258,000 over 4,900 direct labor hours, giving 52.65 per direct labor hour.
Step 6 — Apply the Rate to Products or Cost Centers
Applied overhead equals the rate multiplied by the activity the job consumed. Take a molded bracket that runs 3.5 minutes of press time. That is 0.058 machine hours, so molding overhead applied is 2.75 at the departmental rate. Assembly takes 0.10 direct labor hours, adding 5.27.
Add direct costs and you have total manufacturing cost per part: 2.80 for resin, 1.15 for direct labor, and 8.02 of applied overhead, for a total of 11.97 per part. Now apply the plantwide labor-hour rate instead and overhead drops to 4.90, a full 3.12 per part understated, because the press ran 800 machine hours out of a labor base that barely moved. Multiply that error by 400,000 parts a year and you have a real margin problem, not a rounding error.
Once a full manufacturing cost exists, the natural next question is what that part costs to own after it ships. Total cost of ownership for a part adds service, warranty, and logistics costs that never appear in the factory cost roll.
Step 7 — Validate, Document, and Update the Rate
Close the loop by comparing what you applied with what you spent. In the example plant, actual overhead came in at 738,000, mostly energy and maintenance, while actual machine hours were 11,900 against the 12,400 budgeted.
Overhead applied to jobs was 11,900 multiplied by 57.26, or 681,394. That leaves 56,606 underapplied. Under absorption costing, most companies charge it to cost of goods sold or prorate it across work-in-process, finished goods, and cost of goods sold. Small balances for the year can sit in COGS; large ones usually mean the denominator assumption was wrong and deserve a rate review instead of a journal entry.
Document three things every period: the pool definition, the driver chosen for each pool, and the capacity assumption. Then set the cadence. Annual is normal for a stable plant, quarterly for a seasonal one, and monthly for a job shop with volatile quoting.
Common Mistakes
Using One Rate for Every Cost Pool
A single plantwide rate is convenient and usually wrong across departments. Separate rates for energy, depreciation, maintenance, and support labor follow each cost to the activity that caused it, and the sum still ties back to the same total pool.
Using Units Produced During Periods of Unused Capacity
When output drops and the pool stays flat, a unit-based denominator quietly inflates overhead per unit. High-volume parts absorb an inflated rate and look unprofitable, while the idle capacity cost belongs in the period. Base the rate on normal capacity and report the gap separately.
Treating Mixed Costs as Entirely Fixed or Variable
A utility bill has a floor and a variable portion. Classify it as fully variable and you load idle time into every job; classify it as fully fixed and profitable jobs carry the whole building. Split it using historical data, an engineering estimate of the base load, or a documented high-low approach, and re-test it annually.
Including Direct Costs or General Administrative Expenses
Direct materials and direct labor are traced, not allocated, so leaving them in the pool double-counts them. Front-office salaries, marketing, interest, and research are period costs under GAAP. Pulling them into the rate inflates inventory value and misstates margins until someone audits it.
Changing the Denominator Without Reassessing the Cost Driver
Switching from labor hours to machine hours because the new denominator produces a nicer product cost is backwards. Revisit the driver only when the process, the equipment, or the cost structure has actually changed, and record the reason in the rate memo.
Skipping Reconciliation and Governance
Without a monthly reconciliation of budgeted, actual, and applied overhead, a wrong rate can run for years. Assign an owner for the rate, review underapplied overhead each period, and keep the calculation file, the pool definition, and the approval record together so a financial or operational audit can trace any number back to its source.
Frequently Asked Questions
What is the difference between a predetermined overhead rate and an actual overhead rate?
A predetermined rate is set before the period starts, using estimated overhead divided by estimated activity, and it is used to cost jobs as they run. An actual rate divides the overhead really incurred by the activity really consumed, which you only know after the period closes. Companies need the predetermined rate because inventory and quotes cannot wait for year end.
Should manufacturing overhead be allocated using units produced or machine hours?
Use units produced when cycle times are similar across parts and the operation is simple. Use machine hours when equipment drives the cost, especially in automated cells where labor content is low. The rule of thumb: pick the unit of activity that caused the cost, not the one that is easiest to export from your accounting system.
Is factory depreciation part of manufacturing overhead?
Yes. Depreciation on production equipment, molds, tooling, and building improvements used in manufacturing is factory overhead. Depreciation on office equipment, vehicles used by sales staff, or software used by finance is a period expense and stays out of the pool. Allocate equipment depreciation over the same driver as that asset’s activity, usually machine hours.
How do you calculate overhead per unit when production volume changes?
Keep the cost pool forecast for the planned volume, divide by expected activity at normal capacity, and hold the rate steady through the period. Recalculate rather than reprice mid-period, and report the gap between applied and actual overhead at period end. If volume swings hard, move to quarterly rate updates instead of absorbing all of it in one quarter.
Should a small manufacturer use a plantwide rate or department-level rates?
A plantwide rate is fine when one or two cost centers exist, labor content is meaningful, and the operation is stable. Split into departmental rates as soon as departments have very different cost drivers, such as a highly automated cell beside a labor-intensive assembly line. Keep the math identical across departments so the rates still sum back to the total pool.
Conclusion
A defensible overhead rate comes from three decisions: which indirect costs are in the pool, which activity caused them, and how much of that activity you expect. Divide the normalized pool by the driver, apply the result to each job’s real activity, and reconcile applied against actual every period.
Start by separating your fixed, variable, and mixed pools, then confirm that the allocation driver matches how each cost is actually incurred. Everything else in the process follows from those two choices.