
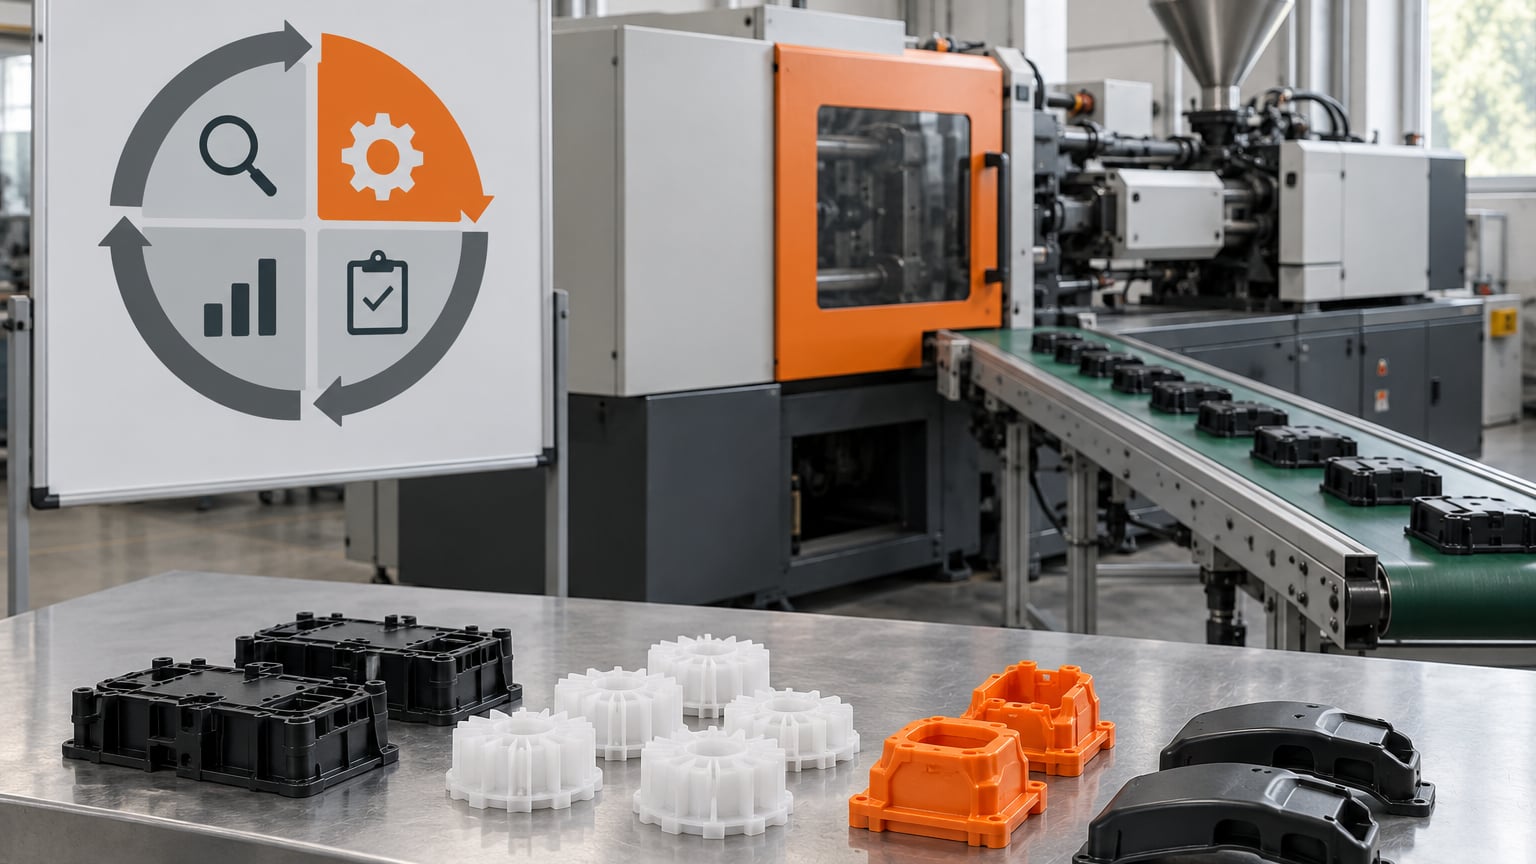
PDCA cycle examples in manufacturing show up in one place more than any other: a plant that keeps fixing the same defect, the same downtime, the same mispack, and never locks the fix in. The PDCA cycle is a four-step method — Plan, Do, Check, Act — for solving a process problem, testing one change at a small scale, measuring whether it worked, and then standardizing it or starting over with a new hypothesis.
The cycle is also called the Deming cycle, the Shewhart cycle, or the Deming wheel, and it sits at the heart of lean manufacturing and the Toyota Production System. What follows are ten worked examples taken from the everyday problems running plants actually own — molding defects, unplanned downtime, changeover time, incoming inspection, safety, scrap, OEE, first-pass yield, supplier quality and packaging accuracy. Each one shows what the team planned, what it tried, what it measured, and what it locked in.
One word of caution before you start. The numbers below are realistic plant ranges and illustrative scenarios, not a promise about your line. Always baseline your own process first, then set the target from that baseline.
Table of Contents
- PDCA Cycle Examples in Manufacturing at a Glance
- 1. Reduce Injection Molding Defects with PDCA
- 2. Reduce Unplanned Machine Downtime with PDCA
- 3. Shorten Changeover Time with PDCA
- 4. Improve Incoming Material Quality with PDCA
- 5. Strengthen Operator Safety with PDCA
- 6. Reduce Scrap and Material Yield Loss
- 7. Improve Overall Equipment Effectiveness with PDCA
- 8. Raise First-Pass Yield with PDCA
- 9. Correct a Repeat Supplier Quality Problem
- 10. Improve Packaging and Kitting Accuracy
- Frequently Asked Questions
- What is the best PDCA example for a manufacturing team to start with?
- How long should a manufacturing PDCA project run?
- Which metrics should be tracked during a PDCA cycle?
- How is PDCA different from a corrective action or CAPA process?
- What are the most common mistakes when applying PDCA in manufacturing?
- Conclusion: Start With One Measurable Manufacturing Problem
PDCA Cycle Examples in Manufacturing at a Glance
| Area | Problem | Plan | Do | Check | Act | Likely KPI |
|---|---|---|---|---|---|---|
| Injection molding | Warpage and short shots on one part | Baseline scrap, list likely causes | Run a mold setting trial on one machine | Compare defect rate and first-pass yield | Update molding range and setup sheet | Scrap rate, first-pass yield |
| Maintenance | Same conveyor fails repeatedly | Pull 12 months of MTBF data | Install the agreed preventive maintenance task | Compare downtime hours and MTBF | Add the task to the PM schedule and SOP | MTBF, MTTR, downtime hours |
| Changeover | Setup takes 90 minutes per product | Time every step, split internal and external | Trial SMED changes on three changeovers | Time each step again with two people | Rewrite the changeover standard work | Changeover minutes |
| Receiving | Lot failures from one material grade | Define acceptance criteria and sample size | Inspect 20 lots with new checks | Compare lot acceptance and defect data | Update receiving inspection controls | Lot acceptance rate, incoming defects |
| Safety | Near miss at the loading station | Map the hazard, find the near-miss reports | Guard and marker changes on a pilot line | Observe the task, review incident rate | Revise the procedure, retrain, audit | Near-miss reports, recordables rate |
| Material yield | Runner and purge waste out of control | Measure yield by cavity, material, shift | Adjust barrel temperature and hold pressure | Weigh scrap samples across three runs | Update molding ranges and operator checklist | Material yield, scrap pounds per run |
| OEE | Line 3 availability sits near 60% | Split losses into the six big ones | Cut minor stops with a rapid-changeover trial | Recalculate availability, performance, quality | Roll the same fixes to Line 4 | OEE, minor stops per shift |
| Quality | One defect mode drives most rework | Isolate the defect mode with Pareto data | Change one process setting or check method | Inspect a representative sample | Revise the control plan reaction limit | First-pass yield, ppm |
| Purchasing | Supplier misses spec repeatedly | Write the spec and pull lot history | Contain the lots, run a trial shipment | Compare incoming results to the standard | Formal supplier corrective action | Supplier ppm, incoming rejections |
| Packaging | Mispacks and missing components | Log mispack codes for four weeks | Trial a scan-verified pack checklist | Audit pack accuracy across orders | Standardize the checklist and kitting step | Pack accuracy, mispacks per 1,000 |
Read across any row and the shape of the method is the same every time. One measurable problem, one small change, one measurement, one standard to update. That consistency is what makes PDCA usable as a daily shop-floor routine rather than a once-a-year improvement project.
1. Reduce Injection Molding Defects with PDCA
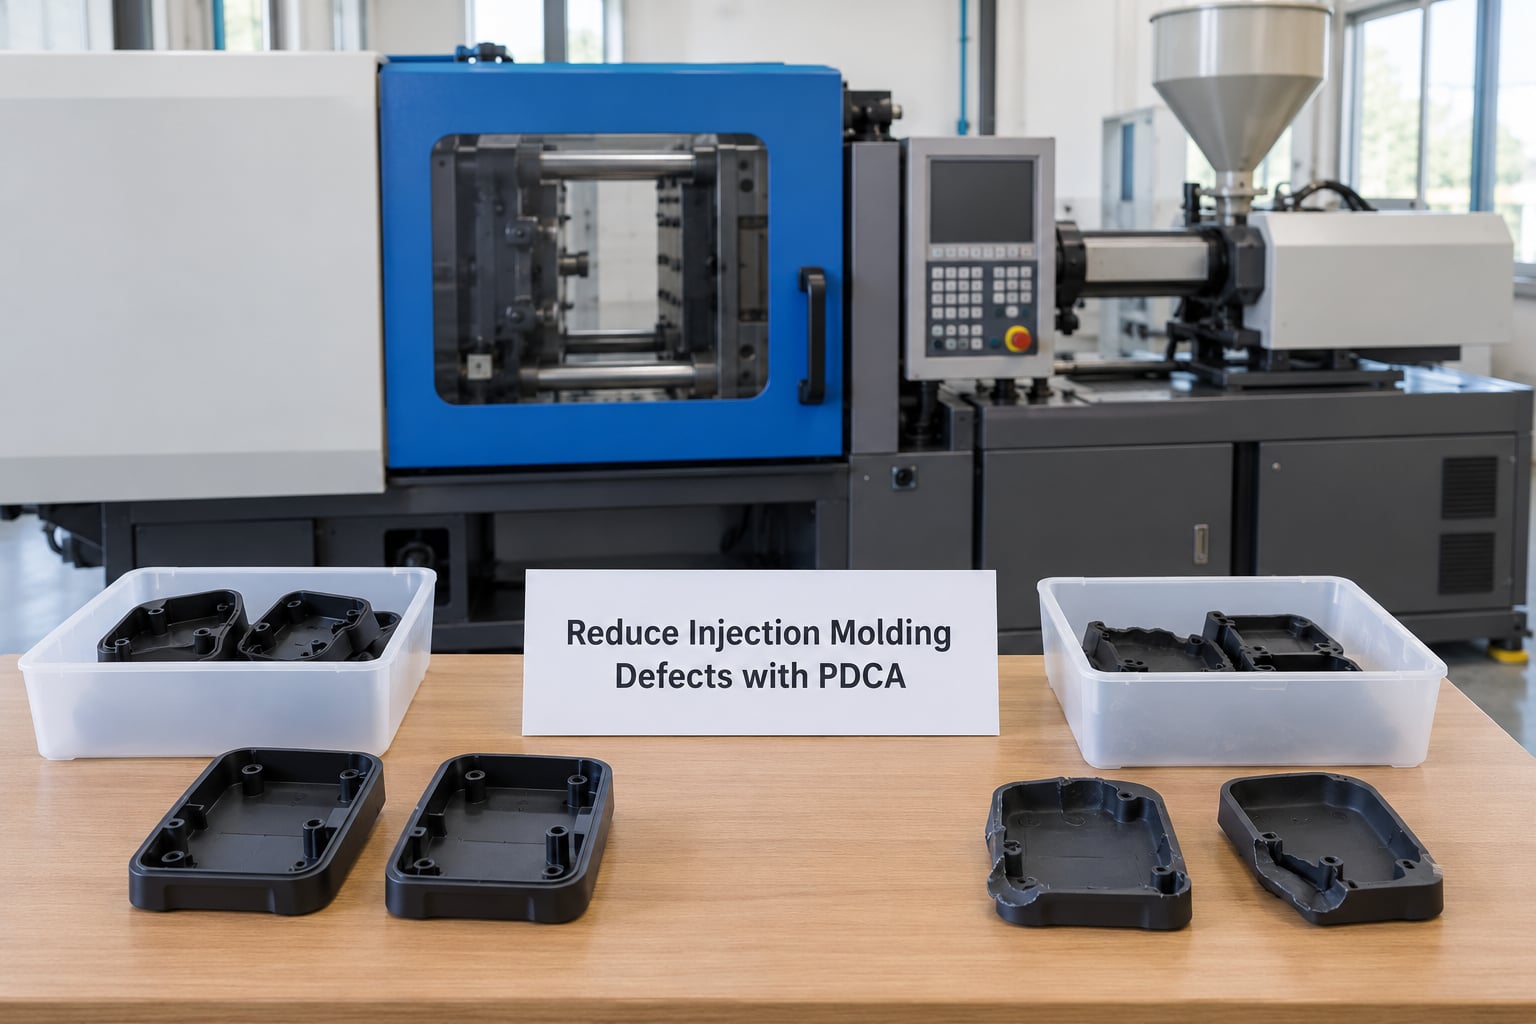
This cycle targets a specific defect, not general quality. A plastics team sees warpage on one part number after a material lot change, and instead of raising the alarm they put it through a four-phase cycle.
Plan: Baseline three shifts of data. The scrap rate on that part number runs 6.2% and first-pass yield sits at 88%. The team lists likely causes — melt temperature, hold pressure, packing time, and moisture in the resin — and picks the cheapest to test first, which is a barrel temperature shift on the two zones nearest the gate.
Do: One machine, one shift, one change. The setter adjusts the two zones by 5 degrees and runs 200 shots, keeping everything else fixed so the result can be read cleanly.
Check: Scrap drops to 3.1% and first-pass yield climbs to 94% across the 200-shot sample. Two more runs confirm the result is repeatable, which matters more than the first number.
Act: The new temperature range goes into the setup sheet and the molding checklist, and the quality engineer adds a first-article dimensional check at 50 shots so a drift gets caught before a full run.
2. Reduce Unplanned Machine Downtime with PDCA
Maintenance teams usually start here because the baseline is already sitting in the CMMS. A packaging line loses roughly 14 hours a month to the same conveyor drive fault, so the cycle looks at failure frequency rather than opinion.
Plan: Pull twelve months of data and compute MTBF for that drive, then split each failure into a failure cause and a repair duration to get MTTR. The team finds nine failures clustered around one photo-eye and no lubricant check in the routine.
Do: Install a fixed bracket so the sensor cannot drift out of alignment, and add a 30-second photo-eye cleanliness check to the hourly operator walk.
Check: Over the next two months the drive records one failure instead of nine. Downtime on that asset falls from about 14 hours a month to under 2, and MTBF stretches past 1,000 operating hours.
Act: The bracket goes into the spare parts kit, the walk step becomes part of standard work, and the whole line gets the same photo-eye mount update. When the root cause is unclear, running a structured investigation first saves far more hours than guessing — root cause analysis methods for manufacturing defects walks through the tools that get you to a cause instead of a symptom.
3. Shorten Changeover Time with PDCA
A plant running high-mix, low-volume batches lives or dies on changeover time. This example starts with a two-hour-plus changeover between a 500 mL bottle and a 250 mL bottle on the same machine.
Plan: Time every step of six recent changeovers and split them into internal work (machine stopped, mold engaged) and external work (prep done while running). Internal work is 118 of the 126 minutes. The team picks two targets: move mold temperature and hose prep outside the stop, and run the die and changeover in parallel.
Do: Trial it on three consecutive changeovers. Preliminary tasks get pulled off-line while the old mold is still running, and a second operator starts bolt removal the moment the machine stops.
Check: Changeover drops to 64 minutes, with internal work down to 31 minutes. Any step that got shorter shows up clearly on the sheet, and two steps that got slower get flagged rather than quietly kept.
Act: The new sequence becomes the changeover standard work posted at the machine, with the external tasks added to the operator’s shift-start checklist. If your plant is at the beginning of this work, setup reduction SMED explained for manufacturing teams covers how to separate those internal and external steps in the first place.
4. Improve Incoming Material Quality with PDCA
Receiving rarely has a strong process because acceptance is often a judgment call. This cycle replaces the judgment call with numbers and tests whether the numbers actually separate good lots from bad ones.
Plan: Define written acceptance criteria for a resin grade — viscosity range, melt flow, and moisture — and pick a sample size per lot. The team then reviews six months of supplier lot history to see where rejections concentrate.
Do: Inspect 20 consecutive lots with the new checks, and record the result of every one, including the lots that pass. Testing only failures teaches you nothing.
Check: Lot acceptance rate moves from 86% to 95%, and the correlation between the moisture reading and the rejection rate is strong enough to justify the test. Two readings sit right on the acceptance edge, which tells the team where the specification needs a second look.
Act: The moisture check goes into the receiving SOP, receiving updates its inspection frequency for that supplier, and the quality agreement with the supplier names the same test method so both sides measure the same property.
5. Strengthen Operator Safety with PDCA

Safety cycles fail when people treat near-miss reporting as an admission of error. The teams that run this one well report near misses faster than they report injuries, because the report is the raw material for the cycle.
Plan: After a near miss at the palletizing station, the team walks the task and maps every step with an operator who does the job daily. Over the previous quarter, six near misses involved a pallet truck in the aisle and one involved reaching past a running conveyor.
Do: Two changes get trialed for a week: a floor-marked pedestrian lane with a barrier at the crossing, and a light curtain mounted at the conveyor reach point. Both are reversible, which makes operators far more willing to try them.
Check: The team observes the task across 20 cycles rather than a single hour, which is where most safety checks go wrong. Zero aisle incidents occur during the trial, and observation shows operators no longer reach past the conveyor. Near-miss reports go up, which is a good sign, not a bad one.
Act: The lane marking and barrier become permanent, the light curtain goes into the standard work and the training matrix, and supervisors run a weekly one-month follow-up audit for the first quarter. A safety cycle that ends with a training session alone tends to fade; the audit keeps it alive.
6. Reduce Scrap and Material Yield Loss
Scrap and yield are different problems, and this cycle treats them separately. Scrap is parts rejected by quality. Yield loss is material that never becomes a part at all — runners, purges, and off-spec shots.
Plan: Weigh the purge bucket and the runners for one week, then break the number down by cavity, color, and shift. One cavity in a six-cavity tool is losing 4% more material than the others, and the night shift’s number is consistently worse.
Do: Adjust hold pressure and cooling time for that cavity only, and add a runner weight target to the setup sheet. The night shift runs the same setup for a week to see whether the difference is people or parameters.
Check: Material yield on the affected cavity rises from 88% to 93%, and the shift gap closes once the parameter is documented rather than set from memory. Weighing samples from three separate runs keeps the number honest.
Act: The new parameter range replaces the old one in the molding range table, the runner weight target becomes an in-process check, and operators get a short refresher on why that cavity behaves differently.
7. Improve Overall Equipment Effectiveness with PDCA
OEE is usually too broad to attack directly, so this cycle works one loss category at a time. Line 3 availability sits near 60%, and the team starts by splitting the downtime into speed loss, minor stops, changeover time, and full breakdowns.
Plan: Two weeks of production data show minor stops of under five minutes account for the largest single block of lost time — roughly 4.5 hours per shift. Nothing in the data looks like a root cause, so the team picks a countermeasure it can test in days rather than weeks.
Do: A rapid-changeover trial: predefined tool positions, a shadow board for fixtures, and a standard first-piece routine. The trial runs on two shifts so the change is tested with more than one crew.
Check: Minor stops fall from 26 per shift to 9, availability rises to 74%, and OEE moves from 52% to 63% once performance and quality are recalculated over the same period.
Act: The layout changes are permanent on Line 3 and the same standard work is rolled out to Line 4 the following month. Rollouts usually fail because nobody re-measures, so the second line gets its own baseline before the changes go in.
8. Raise First-Pass Yield with PDCA
First-pass yield is where quality and production meet, because it counts parts that pass inspection with no rework, no retest and no concession. The strongest PDCA cycle examples in manufacturing treat it as one metric that both departments own.
Plan: Build a Pareto of defects over four weeks. One mode — a short shot on a thin-wall part — accounts for most of the rework hours, so that is the target. The baseline is a first-pass yield of 91%, with the target set at 96% after the baseline is confirmed across two weeks.
Do: The team changes two things at once on one line: a slower screw decompression setting, and an in-process gauge check every 30 parts instead of every 100.
Check: First-pass yield reaches 95% over 1,200 parts, and the defect drops out of the top three entirely. Because two changes were made, the team then isolates the gauge frequency on a second line so the result is not credited to the wrong change.
Act: Both changes go into the control plan, the sampling frequency becomes the new standard, and the gauge check is added to the operator’s layer audit so the gain survives the next tool change.
How to Choose Which PDCA Cycle Examples in Manufacturing to Run First
Rank candidates on three things: how much output the problem costs, whether you can measure it today without new tooling, and whether one team can change it without a budget request. Pick the highest-scoring one that passes all three, run it to completion, then take the next. A finished cycle beats an ambitious queue — the credibility you build with the first one is what gets you the resources for the second.
9. Correct a Repeat Supplier Quality Problem
Supplier problems need a different Act phase, because your leverage is in the agreement, not just the incoming inspection. A supplier has missed the same dimension three times in two quarters on an injection-molded component.
Plan: Write the specification with a numeric tolerance and a stated measurement method, then pull the lot history to confirm the pattern is real and not one inspector being stricter than the next.
Do: Contain the current lots with 100% inspection on the suspect dimension, and send a formal corrective action request that names the data. The supplier then runs a trial shipment built to the clarified method.
Check: The trial lot measures on the first incoming check. Two more lots follow over the next six weeks with zero out-of-tolerance parts, which is enough to move from containment back to normal sampling.
Act: The supplier closes the corrective action with a documented process change, the purchase order and control plan now state the measurement method, and the incoming sampling plan drops back to the reduced level. If it slips again, the written record is what makes the next escalation a fact rather than an argument.
10. Improve Packaging and Kitting Accuracy
Mispacks are cheap individually and expensive in aggregate, and they always surface at the customer’s dock rather than yours. A kitting line logs 40 mispack events across four weeks, half of them a missing accessory.
Plan: Code each mispack by type and station. The pattern shows 14 of 20 sampled events happened at one station where two operators alternate, and the manual checklist has no signature line.
Do: The team trials a revised checklist with a scan verification at each bin pick, plus a photo confirmation on the finished carton for the first week. Only one line runs the new method.
Check: Pack accuracy across 60 audited orders rises from 97.2% to 99.4%, and mispacks drop from about 12 per week to 2. The two remaining events trace to a component that ships in two different bin locations, which is a design problem, not an operator problem.
Act: The scan-verified checklist becomes the standard, the second bin location is consolidated in the kitting layout, and the accuracy audit stays in place for 90 days. If your plant handles kits of any complexity, what kitting means in manufacturing and when to use it covers where kitting pays off and where it adds handling for nothing.
Frequently Asked Questions
What is the best PDCA example for a manufacturing team to start with?
Start with unplanned downtime on a single critical asset. Downtime data usually already exists in the CMMS, the cause is often a small fixable detail such as a sensor position or a missing lubrication step, and the result shows up within weeks. It also builds credibility for the harder projects, like defect rate reduction, that follow.
How long should a manufacturing PDCA project run?
Most plant cycles that get completed run four to eight weeks. Plan and Do can take a week or two, but the Check phase needs enough production volume to make the number trustworthy, which usually means a minimum of several days of real output. Teams that rush Check end up standardizing a change that never actually worked.
Which metrics should be tracked during a PDCA cycle?
Track one outcome metric and two process metrics. Outcome examples are scrap rate, first-pass yield, downtime hours per month, changeover minutes and pack accuracy. Process metrics cover the things you changed, such as minor stops per shift or inspections passed per lot. Pick the metric in the Plan phase and change nothing about it later, or the comparison loses meaning.
How is PDCA different from a corrective action or CAPA process?
PDCA is a problem-solving method: it finds and tests a fix for a process that works badly most of the time. Corrective action and CAPA handle a specific nonconformance, usually one that escaped to a customer or failed an audit. In a certified plant the two connect, because a PDCA cycle that changes a process normally requires a matching corrective action record.
What are the most common mistakes when applying PDCA in manufacturing?
Four mistakes cause most stalled cycles. Testing on the whole line instead of one machine or shift, skipping a real baseline, changing two things at once so nobody knows which worked, and ending the Act phase with a meeting rather than an updated standard. Each one is easy to fix in advance and expensive to fix afterward.
Conclusion: Start With One Measurable Manufacturing Problem
Pick the bottleneck with measurable output — scrap pounds, downtime hours, changeover minutes or mispacks per week — and run one complete PDCA cycle on it. Baseline the number first, name one owner, test a single small change on one line, and review the evidence before scaling anything to the rest of the plant.
These PDCA cycle examples in manufacturing all follow the same rhythm: one problem, one test, one number, one standard. Teams that close the Act phase properly are the ones still running the improvement a year later, because the gain lives in the setup sheet, the control plan and the standard work rather than in one person’s memory. In 2026, that is still the whole difference between an improvement program and a suggestion box.