

The inventory turnover ratio tells you how many times a company sells and replaces its stock during a period. You calculate it by dividing cost of goods sold by average inventory value, and it takes about 20 minutes once your period and valuation method are settled.
Most bad numbers come from mixing periods rather than from bad arithmetic. Fix the reporting period, decide how inventory is valued, then pull the two numbers.
Inventory turnover ratio = Cost of goods sold (COGS) ÷ Average inventory value
Average inventory value = (Beginning inventory + Ending inventory) ÷ 2
In plain terms: how many complete sell-through cycles did your stock complete while you owned it? In the example below, a mid-sized packaging manufacturer works through its inventory about 5.7 times a year, which works out to roughly 64 days of stock on hand.
Table of Contents
- What You Need
- Step-by-Step
- Frequently Asked Questions
- What is the inventory turnover ratio formula?
- Should I use COGS or sales in the calculation?
- How do I calculate turnover for raw materials, WIP and finished goods?
- Is a monthly calculation better than an annual one?
- What is a good inventory turnover ratio for manufacturing?
- What is the difference between inventory turnover and days inventory outstanding?
- Conclusion: Start With One Reliable Period
What You Need
You need three inputs and three decisions made before you touch a calculator. The decisions matter more than the numbers, because two companies with identical stock can produce very different ratios by choosing different periods and valuation rules.
The three inputs are:
- Cost of goods sold for the period, taken from the income statement or rebuilt from the general ledger.
- Beginning inventory value at the start of the period.
- Ending inventory value at the close of the period, at the same valuation method as the beginning figure.
The three decisions are:
- Reporting period. Monthly, quarterly or annual. Whatever you pick, the COGS figure and both inventory snapshots must cover exactly the same span of time.
- Valuation method. FIFO, weighted average or LIFO, applied consistently to both snapshots. Mixing methods inflates or deflates the result without any real change in physical stock.
- Cost basis. Standard cost, actual cost or landed cost. Landed cost includes freight and duties, so an ERP that tracks landed cost will report a higher COGS than one using standard cost, and a higher ratio with it.
For manufacturers, decide in advance whether you are measuring raw materials, work in process and finished goods together or separately. Mixed totals are fine for a first pass, but they hide which stage of the operation is actually slow.
Once the period is locked, gather inventory records you can trust. Where counts are unreliable, the accuracy problem is usually the counting method rather than the maths, and RFID versus barcode for inventory tracking is worth a look before you trust the output.
Step-by-Step
Step 1: Define the Reporting Period
Pick one period and write it down: “FY to 31 March” or “Q3, 1 July to 30 September”. Then confirm that the cost of goods sold you plan to use covers those exact dates.
A frequent error is dividing a full-year COGS figure by the average of a quarter’s inventory, which inflates the ratio roughly fourfold. If you can only get a quarterly view, annualise the COGS by multiplying by four and use four quarterly inventory snapshots instead of two.
It worked if a colleague reading your spreadsheet can tell, without asking, which dates the ratio covers.
Step 2: Calculate Average Inventory
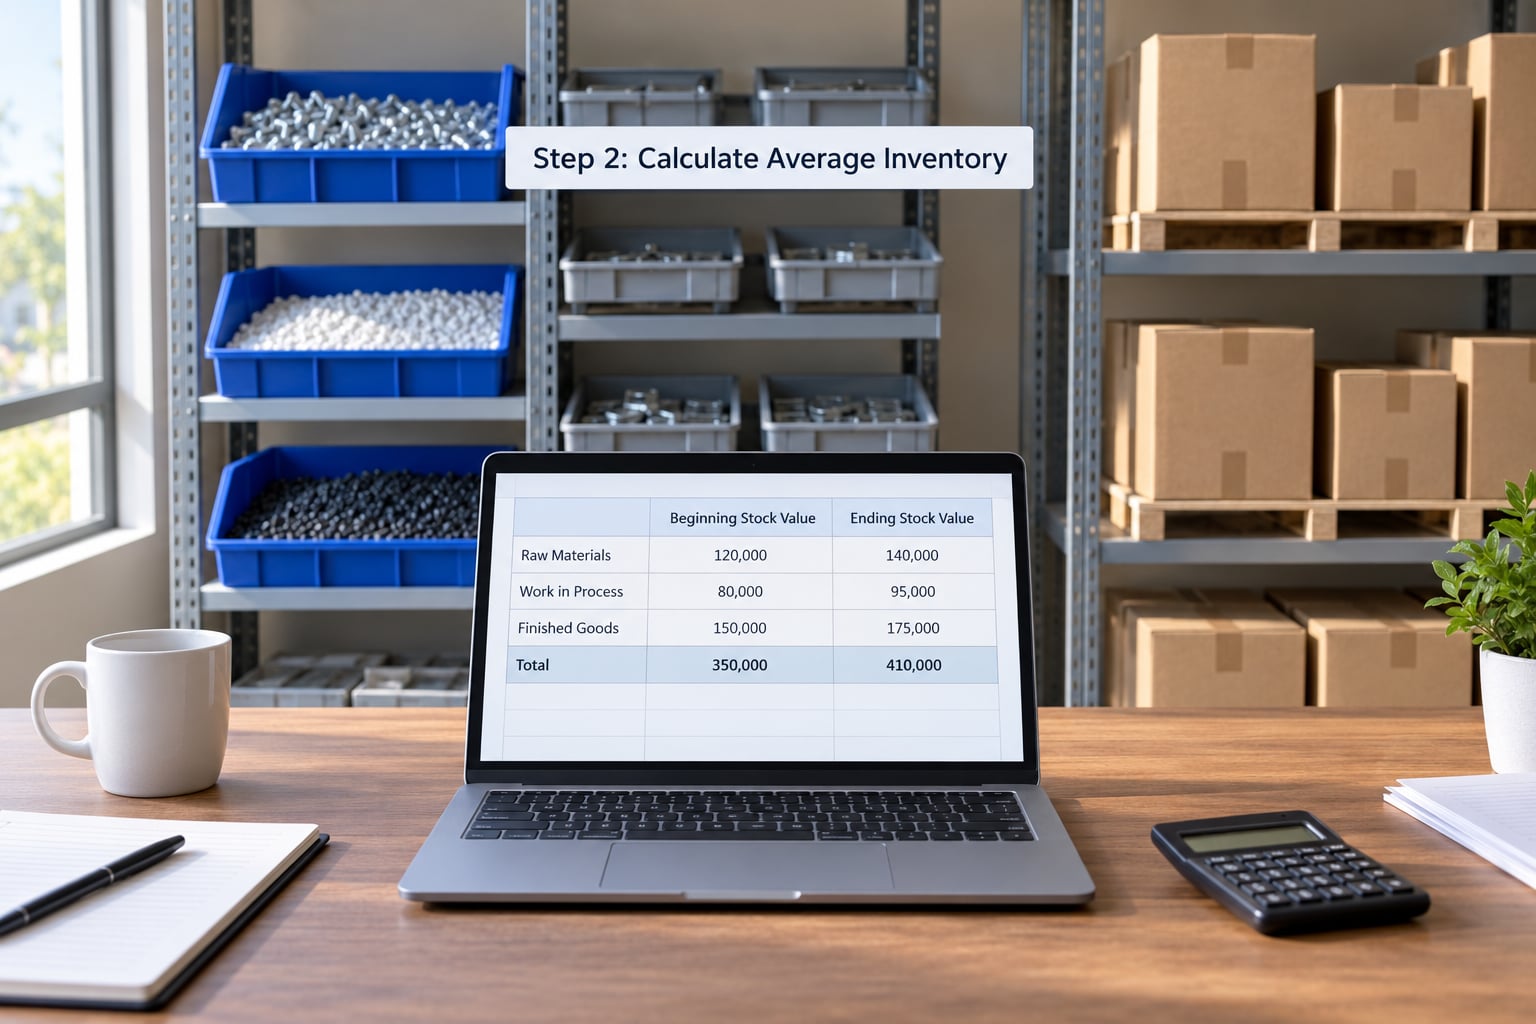
Average inventory smooths the starting and closing positions so that stock built in one month and drawn down in the next does not distort the result. Use the two-point method when you have nothing else:
Average inventory = (Beginning inventory + Ending inventory) ÷ 2
A packaging manufacturer in the example starts the year with raw materials of 180,000, work in process of 95,000 and finished goods of 425,000, totalling 700,000. At year end the same three groups stand at 145,000, 88,000 and 367,000, totalling 600,000. Average inventory is therefore (700,000 + 600,000) ÷ 2 = 650,000.
The two-point average is crude when stock moves unevenly through the year. Taking twelve monthly snapshots and averaging those is more accurate, and the difference matters most in seasonal businesses where December inventory is nothing like July inventory. If your ERP cannot produce monthly valuations, a quarter-end schedule of physical counts is a workable substitute.
It worked if your beginning figure plus purchases minus issues equals your ending figure for each material group. That tie-out is the cheapest accuracy test there is.
Step 3: Select the Correct Sales or COGS Figure
Use cost of goods sold, not sales revenue. Inventory is carried on the balance sheet at cost, so dividing a cost-based inventory value by a revenue figure mixes two different bases and usually produces a flattering ratio.
The exception is the unit-velocity method used in ecommerce and distribution, where turnover is expressed as total units on hand divided by average units sold per period. That approach is legitimate because both sides use units, and it is the right lens when you are managing SKU velocity rather than reporting a financial ratio.
Back to the manufacturer: full-year COGS is 3,700,000. Two adjustments matter in a plant. First, internal transfers between raw materials and work in process are not sales, so exclude them from the numerator, otherwise double counting inflates turnover. Second, scrap and obsolescence write-offs sit in COGS but represent no sale, so strip them out if your ERP keeps them as separate cost lines.
Returns are the same problem in reverse. A customer return should reduce both COGS and inventory in the period it is processed, and if your system books the return into a separate account, adjust the figure before you divide.
It worked if your COGS ties to the inventory movement schedule: opening stock plus purchases minus adjustments equals closing stock, with no unexplained residual.
Step 4: Calculate Inventory Turnover Ratio
Divide COGS by average inventory, using the same time span for both figures:
Inventory turnover ratio = COGS ÷ Average inventory
For the manufacturer: 3,700,000 ÷ 650,000 = 5.7. Stock was sold and replaced about 5.7 times during the year.
To express the same figure as days, divide 365 by the ratio: 365 ÷ 5.7 = 64 days of inventory on hand. That is often the number operations teams actually use, because it drops straight into a replenishment conversation.
| Turnover ratio | Days inventory on hand |
|---|---|
| 2 | 183 |
| 4 | 91 |
| 6 | 61 |
| 8 | 46 |
| 10 | 37 |
| 12 | 30 |
It worked if the ratio, when multiplied by average inventory, gives back your COGS figure to the nearest rounding.
Step 5: Interpret the Result
A ratio of 1.5 means inventory was sold and replaced one and a half times during the period, which works out to about 243 days on hand. Whether that is acceptable depends entirely on what you sell.
General ranges for planning purposes, not targets to hit:
| Segment | Typical annual turns | Days on hand |
|---|---|---|
| Grocery and fast-moving consumer goods | 10 to 20 | 18 to 37 |
| Retail and apparel | 6 to 10 | 37 to 61 |
| Electronics and consumer hardware | 4 to 8 | 46 to 91 |
| Manufacturing | 4 to 8 | 46 to 91 |
| Heavy equipment and industrial | 1 to 4 | 91 to 365 |
Compare the number against your own history first and published peer data second. A plant that moved from 4.2 to 5.7 turns has improved, even if a competitor sits at 7.
Low turnover ties up cash in slow-moving stock, raises carrying costs and invites obsolescence. High turnover releases cash quickly, but a figure that is very high for your category can signal stockouts, lost sales and emergency replenishment at premium freight cost. Neither extreme is automatically good.
The bigger problem is that one company-wide ratio hides everything. Break it out by raw materials, work in process and finished goods, then by SKU group. In the worked example, raw materials might turn 9 times while finished goods turn 3, and the aggregate of 5.7 tells you nothing about either.
Step 6: Improve Inventory Performance
Once you can see which groups drag the average down, act on those groups in this order:
- Set review triggers for slow movers. Flag any SKU with no movement in 90 days, then decide per item: return to supplier, liquidate, bundle, or scrap and write off.
- Correct reorder points. Recalculate using actual lead times and demand variability rather than last year’s habit. Our guide to how to calculate safety stock levels covers the buffer side of the calculation.
- Cut order quantities on steady items. Smaller, more frequent buys at the same annual volume reduce cycle stock and often improve supplier reliability at the same time.
- Rationalise the range. Run an ABC inventory analysis and hold deep cover only on the items that actually move. Low-value, slow-moving SKUs are where cash quietly disappears.
- Fix forecast error on repeat orders. Compare purchase quantity against actual consumption for the last eight orders. Persistent over-ordering shows up here.
- Shorten supplier lead times where you can. Reliable shorter lead times let you carry less buffer without raising stockout risk.
- Re-measure next period. Recalculate on the same basis and compare like for like, otherwise you cannot tell improvement from a change in method.
To estimate the cash benefit, multiply the average inventory you removed by your carrying cost rate. Cutting 100,000 of average inventory at a 25 percent annual carrying cost releases roughly 25,000 of working capital a year, which is usually the number that gets the project funded.
Common Mistakes
| Mistake | Why it distorts the result | Correction |
|---|---|---|
| Using ending inventory only | Ignores stock built during the period and always reads lower | Average beginning and ending, or use monthly snapshots |
| Dividing sales revenue by inventory | Mixes a revenue base with a cost base and flatters the ratio | Use cost of goods sold |
| Mismatched periods | Annual COGS over quarterly inventory multiplies the ratio by four | Match the COGS span to the inventory span |
| Averaging unrelated periods | A seasonal business compared across two unlike quarters gives noise | Compare the same quarter year over year |
| Leaving returns and write-offs in | Inflates COGS without any matching stock movement | Adjust both numerator and inventory for the same period |
| Treating a high ratio as good | Very high turnover can mean stockouts and lost sales | Track fill rate and lost sales alongside the ratio |
One more that catches people: FIFO versus LIFO. Under rising material costs, LIFO inflates COGS and depresses the ending inventory value, which can push the ratio up even when physical stock levels have not changed. State the method on the report so the next reader knows what they are comparing.
Frequently Asked Questions
What is the inventory turnover ratio formula?
Inventory turnover ratio equals cost of goods sold divided by average inventory value, where average inventory is beginning inventory plus ending inventory divided by two. Use cost of goods sold rather than sales revenue because inventory is carried at cost. Match the COGS period to the inventory period, and apply the same valuation method to both snapshots.
Should I use COGS or sales in the calculation?
Use cost of goods sold for the standard financial ratio, because inventory is recorded on the balance sheet at cost and a sales figure would compare unlike bases. Unit-based turnover is the exception: if you divide total units on hand by average units sold, both sides use the same measure and the result is valid for SKU velocity work.
How do I calculate turnover for raw materials, WIP and finished goods?
Run the same formula three times, once for each group, using the COGS or consumption figure that matches each stock category. Exclude internal transfers between raw materials and work in process so stages are not double counted. Comparing the three results shows quickly which stage of the operation is holding the most capital.
Is a monthly calculation better than an annual one?
Monthly is usually better, because twelve snapshots give a truer average than two and seasonal businesses see their real peak and trough. Monthly COGS is divided by average monthly inventory, which gives a monthly turns figure that you annualise if needed. Use quarterly or annual only when monthly valuation data does not exist.
What is a good inventory turnover ratio for manufacturing?
Most manufacturers land between four and eight turns a year, roughly 46 to 91 days of stock on hand. The number that matters is your own trend: moving from 4.2 to 5.7 turns is real improvement even if a peer operates at seven. Compare against your own history before comparing against anyone else.
What is the difference between inventory turnover and days inventory outstanding?
They express the same thing in different units. Inventory turnover counts how many times stock sold through during the period, while days inventory outstanding, also called days sales of inventory, shows how many days of stock you held. Convert between them by dividing 365 by the turnover ratio, which gives days on hand directly.
Conclusion: Start With One Reliable Period
Start with one period where you trust the numbers. Pick the dates, write down the valuation method, pull COGS for exactly that span, and average beginning and ending inventory at cost. Divide one by the other and you have a ratio worth arguing about.
Then do the part most guides skip: break it into raw materials, work in process and finished goods, and by SKU group. The group with the weakest number is where your next month of work belongs. Recalculate on the same basis next quarter so you can tell improvement from a change in method.