

Inventory shrinkage is the gap between the stock your system says you have and the stock you can physically find, when no documented transaction explains the difference. It shows up in manufacturing as unrecorded scrap, damaged components, receiving errors, material consumed on the line without a scan, and theft — and every one of those leaks margin while quietly corrupting the inventory data your planning runs on. This guide covers inventory shrinkage causes and prevention on a plant floor: how to measure the gap and which controls actually hold.
The version of this problem most sites describe is a retail store problem: shoplifted merchandise on the sales floor. Manufacturing losses look different. Material moves in bulk, gets consumed in stages, sits in bins between machines, and changes form as it becomes work in process, finished goods, and eventually scrap. A missing pallet of resin in a warehouse and a missing carton on a store shelf are both shrinkage, but they need different controls and different investigations.
That is the framing for everything below. Causes are grouped by what actually goes missing, then by where in the facility it goes missing, and each one is paired with the control that stops it. If your accuracy number is off and you cannot say why, the measurement section comes first.
Table of Contents
- What Is Inventory Shrinkage?
- How to Measure Inventory Shrinkage and Accuracy
- Inventory Shrinkage Causes and Prevention by Loss Type
- How Inventory Shrinkage Causes and Prevention Differ by Location
- Why Inventory Shrinkage Often Goes Unreported
- A Practical Inventory Shrinkage Prevention Program
- How to Build Cycle Counts and Root-Cause Checks That Work
- Which Metrics Should Managers Track?
- Frequently Asked Questions
- What is the difference between inventory shrinkage and manufacturing scrap?
- How often should a warehouse perform cycle counts to find inventory shrinkage?
- Should inventory shrinkage be included in the cost of goods sold?
- What is an acceptable inventory accuracy rate for manufacturers?
- How can a company reduce shrinkage without slowing operations?
- Can insurance cover inventory lost through theft or unexplained inventory variance?
- Conclusion: Start With One High-Risk Inventory Area
What Is Inventory Shrinkage?
Inventory shrinkage is the difference between recorded inventory and physical inventory, expressed in units or dollars, when no approved transaction accounts for it.
Three ideas sit underneath that definition, and mixing them up is why shrink numbers get argued about instead of fixed.
Shrinkage, inventory loss, and write-off are not the same thing
A shrinkage event is unexplained. An inventory loss is explainable but still undesirable — a pallet damaged by a forklift, a container broken in transit. A write-off is the accounting action taken after you have decided the loss is real and will not come back.
Every write-off starts as shrinkage, but not every write-off is shrinkage. Scrapping a batch that failed contamination testing is a documented loss with a cause code and an approval. It still costs you the material, but it is planned, measurable, and it belongs in your cost of goods sold, not in your shrink rate.
Obsolescence and spoilage sit alongside these. A resin lot that ages past its shelf life is obsolescence. Adhesive that cures in the drum is spoilage. Both are real losses, both reduce usable inventory, and both belong in a separate line of your variance report so you can see them apart from the unexplained gap.
| Term | What it means | Has a cause code? | Belongs in shrink rate? |
|---|---|---|---|
| Inventory shrinkage | Recorded stock exceeds physical stock with no approved transaction to explain it | No, or provisional | Yes |
| Inventory loss | Known loss from a specific event such as damage in transit | Yes | Sometimes, tracked separately |
| Write-off | Accounting removal of inventory value from the balance sheet | Yes | No, this is the accounting entry |
| Scrap | Material intentionally discarded because it failed a specification | Yes | No, tracked as yield loss |
| Obsolescence | Stock that will not be used before it becomes unusable | Yes | No, tracked as an aging provision |
| Spoilage | Perishable or time-sensitive stock that degraded in storage | Yes | No, tracked as spoilage |
Why book inventory diverges from physical inventory
Systems do not go wrong on their own. A book-to-physical gap appears when a movement happened and the transaction did not, or when a transaction was posted for something that did not physically occur.
In a plant with paper travelers, that means a work order was closed without recording consumption. With a WMS and barcode scanning, it means someone used a manual override, or a receipt was posted before the material was counted in. Both produce the same arithmetic: the system says 400 pounds, the rack holds 360, and nobody can point to the transaction that moved 40 pounds.
How to Measure Inventory Shrinkage and Accuracy
Three numbers answer most shrinkage questions: dollar shrinkage, inventory accuracy, and count variance. Compute them on a fixed period and a fixed baseline, or the trend is meaningless.
Dollar shrinkage is recorded value minus counted value for the scope you counted.
Unit variance is recorded units minus counted units for a specific SKU at a specific location.
Inventory accuracy is counted locations that matched the system divided by all locations counted. The location count is a location-location match, not a SKU-SKU match, because most programs count a bin and check whether everything in it was right.
Pick your baseline carefully. Most published retail shrink figures are calculated against sales value, while a plant or warehouse usually wants shrinkage against recorded inventory cost or against the value of the SKUs counted. Mixing a retail-value numerator with a cost denominator produces a number that looks small and means nothing. State the basis on the report, every month, so nobody has to guess which one they are reading.
The period matters too. Monthly catches transactional errors within about a month of them happening. Quarterly smooths out seasonal noise. Annual counts alone leave you with a number once a year and no idea when the loss started.
| Method | What it measures | Frequency | Best for | Weakness |
|---|---|---|---|---|
| Cycle counting | Accuracy of high-risk SKUs on a rolling schedule | Weekly to monthly per ABC class | Continuous visibility and root-cause evidence | Needs frozen movements and trained counters |
| Annual physical count | Total book value accuracy at a point in time | Once or twice a year | Financial audit and year-end valuation | Long blind spots, high disruption cost |
| Continuous reconciliation | Transaction-level agreement between ERP, WMS and floor | Daily or weekly, exception-driven | Finding the transaction that broke the chain | Requires clean interfaces and cause codes |
Scope matters more than size. Shrinkage is far easier to investigate when a count starts with a limited group of high-value or high-velocity items instead of the whole catalog. A targeted count tells you something in a shift. A full count tells you a number in a week.
Inventory Shrinkage Causes and Prevention by Loss Type
Theft still drives a large share of reported shrinkage, but it is no longer the only cause that moves the number. Process and control errors sit close behind and, unlike theft, they are almost entirely fixable.
Here are the five that account for the bulk of loss in most facilities.
- External theft — stock removed from the yard, dock, or an unsecured cage by someone who is not an employee. In a plant this usually looks like a bad night on a trailer or a gate that was propped.
- Internal theft — pilferage by employees and contractors: taking consumables home, feeding personal jobs from production material, or skipping a scan so the stock stays invisible on the books.
- Process and data entry errors — receipts posted for the wrong quantity, a receipt posted before the count, an issue posted to the wrong work order, or a manual adjustment nobody can explain later.
- Vendor fraud and short shipments — invoices matching paperwork when fewer units shipped, unauthorized substitutions, or quality issues accepted at receiving and only found months later.
- Damage, spoilage, and expiration — material crushed in a rack, film and drums degraded by heat, adhesive curing in the drum, shelf life exceeded in a lot nobody flagged.
Beyond those five, manufacturing-specific losses belong in the same conversation: unrecorded scrap from start-up waste and purges, work-in-process variance between issued and consumed material, MRO consumables that walk off with a maintenance job, and tooling or molds that leave the tool room and do not come back.
| Cause | How it looks on the floor | Prevention control | Owner |
|---|---|---|---|
| Counting error | Bin counted short because a case was opened and repacked | Blind cycle counts, count sheet shows quantities not locations, second count above threshold | Inventory control |
| Unrecorded scrap | Purges and start-up waste with no scrap ticket | Scrap ticket with cause code at the machine, scrap bin weighed per shift | Production supervisor |
| Damage | Forklift impact, crushed drums, split pallet in the rack | Rack guards, aisle speed rules, damage inspection at putaway and pick | Warehouse manager |
| External theft | Missing pallets at the dock, cut locks, gaps in the yard | Sealed trailers, badge and camera coverage at docks, yard seal checks | Facilities and security |
| Internal theft | Consumables disappearing from the crib, scans skipped at issue | Role-based access, scan-to-confirm at issue, crib issue logging by name, no unscanned pick paths | Operations manager |
| Receiving error | Book quantity higher than what came off the truck | Count and scan at the dock before the receipt posts, blind receiving, over/short tolerance alerts | Receiving supervisor |
| Issuance error | Material issued to a work order that did not consume it | Scan confirmation at issue, backflush verification, WIP reconciliation at work order close | Production control |
| Supplier shortage | Fewer cases in the carton than the packing list shows | Count at receiving, photograph the seal and carton, file shortage claims within the claim window | Purchasing |
| Shipping loss | Short shipment, carrier damage, in-transit discrepancy | Load verification scan, photo at pickup, weight capture, claims filed in days not months | Logistics |
| Record failure | Adjustment made without a cause code or supporting note | Mandatory cause code, blocked overrides above threshold, monthly review of the change log | Finance controller |
How Inventory Shrinkage Causes and Prevention Differ by Location
Shrinkage does not spread evenly across a facility. It concentrates where material changes hands without a record, and the control that matters is different at each hand-off.

The pattern is consistent. Every node where stock is received, staged, consumed, or shipped has a distinct failure mode, and a distinct control that closes it.
| Location | Typical failure | Control that stops it |
|---|---|---|
| Receiving dock | Short or over-shipment accepted without a count | Blind count against the packing list, scan every unit before the receipt posts |
| Raw material storage | Mislabeled or unscanned putaway, mixed lots, wrong FIFO sequence | System-directed putaway, lot and serial capture, FIFO or FEFO enforced at putaway |
| Work in process | Issued material never consumed, partial work orders left open | Backflush verification, WIP reconciliation at close, open-order review weekly |
| Production line | Start-up waste, purges, regrind and scrap not recorded | Scrap ticket with cause code at the station, shift-end reconciliation, downtime tagging |
| Finished goods warehouse | Short picks, unrecorded samples, sample and giveaway stock leaving the building | Scan-to-confirm picks, sample log with approver, controlled pick faces |
| Packaging area | Packaging material consumed without issue, overproduction not recorded | Issue packaging by work order, count finished units at pallet close, tie-back to the order |
| Outbound shipping | Loaded but not scanned, trailer sealed before paperwork, wrong pallet loaded | Load verification scan, seal number recorded, weight capture, photo at pickup |
Cross-dock and multi-location transfers deserve their own line. A transfer that moves stock between two internal locations without a system transaction creates phantom inventory at the source and phantom shortage at the destination. Both eventually get adjusted away, and the adjustments get logged as shrink even though nothing was lost. It is common enough to show up in most plant variance reviews, and it disappears the moment you treat every internal movement as a real receipt and issue.
Why Inventory Shrinkage Often Goes Unreported
Most shrinkage is not hidden deliberately. It is absorbed into other lines until nobody owns it.
Six patterns do most of the burying.
Netting variances against scrap
When a physical shortage is offset against recorded scrap, the shrink looks small enough to ignore. The two numbers are then analyzed as one, and the team concludes that the problem is production waste when part of it is a missing pallet in a rack.
Mixing nonconforming inventory with usable stock
Quarantined material that sits in the same bin as released material gets counted, and the count is wrong in both directions. Put it in a physically separate hold area with its own status, and the counting problem disappears along with the argument.
Delaying transaction corrections
A receipt posted three weeks late still gets posted, and the three-week window is exactly where the loss hides. Corrections that arrive after month-end close will not appear in the variance report that would have flagged them.
Using an inaccurate bill of material
If the standard says 3.2 kilograms and the actual issue is 3.6, every work order creates a small variance and the total looks like a normal yield curve. A BOM that was never validated after a process change quietly manufactures shrink all year.
Failing to record customer returns
Returned material that is not logged as a receipt can be sold, scrapped, or simply never exist as far as the system is concerned. The comparison that would have caught it is the one nobody runs.
Relying on annual counts without reconciliation
A year-end count produces one number with no timeline. You learn that the discrepancy was 1,200 units and never learn which transaction caused it. Monthly reconciliation of movement and count is what turns a number into a cause.
A Practical Inventory Shrinkage Prevention Program
Prevention works as a stack. Any single control can be bypassed; a stack where each layer catches what the layer above missed is what holds.
- Name an accountable owner. Assign one role the accuracy number and one role the write-off. Split ownership means nobody owns the total.
- Fix SKU and location discipline. One SKU per bin location, one location per SKU, real lot and serial capture. A mislabeled bin is a count that will be wrong twice. If you are still deciding how to capture that data, RFID vs barcode for inventory tracking breaks down the tradeoffs.
- Make transactions mandatory. No stock moves without a scan or a signed transaction. If a manual path exists for expediting, log it the same way with a reason code.
- Count by risk, not by calendar. A items counted monthly, B items quarterly, C items annually, with serialized and high-theft-risk goods always on the highest cadence.
- Restrict adjustments. Role-based access, an approval step above a dollar threshold, a mandatory cause code, and a change log that finance reviews monthly.
- Secure the physical layer. Cameras, badge access, cages, and controlled crib issue. Treat this as the layer that raises the cost of opportunistic loss, not the layer that does the work.
- Reconcile every hand-off. ERP to WMS to floor, at least monthly, with exceptions listed and worked rather than netted.
- Investigate repeat variances. The same SKU going short three quarters in a row is a process defect, not a counting error. Assign a corrective action with a named owner and a date, then verify it held.
One caution on the security layer. Heavy-handed surveillance damages the floor and erodes the reporting you need. Procedural discipline, clear store-keeping rules, visible supervision, and greeting routines tend to work better than an accusatory atmosphere. If your controls only work when nobody suspects anyone, they will stop working the day turnover spikes.
How to Build Cycle Counts and Root-Cause Checks That Work
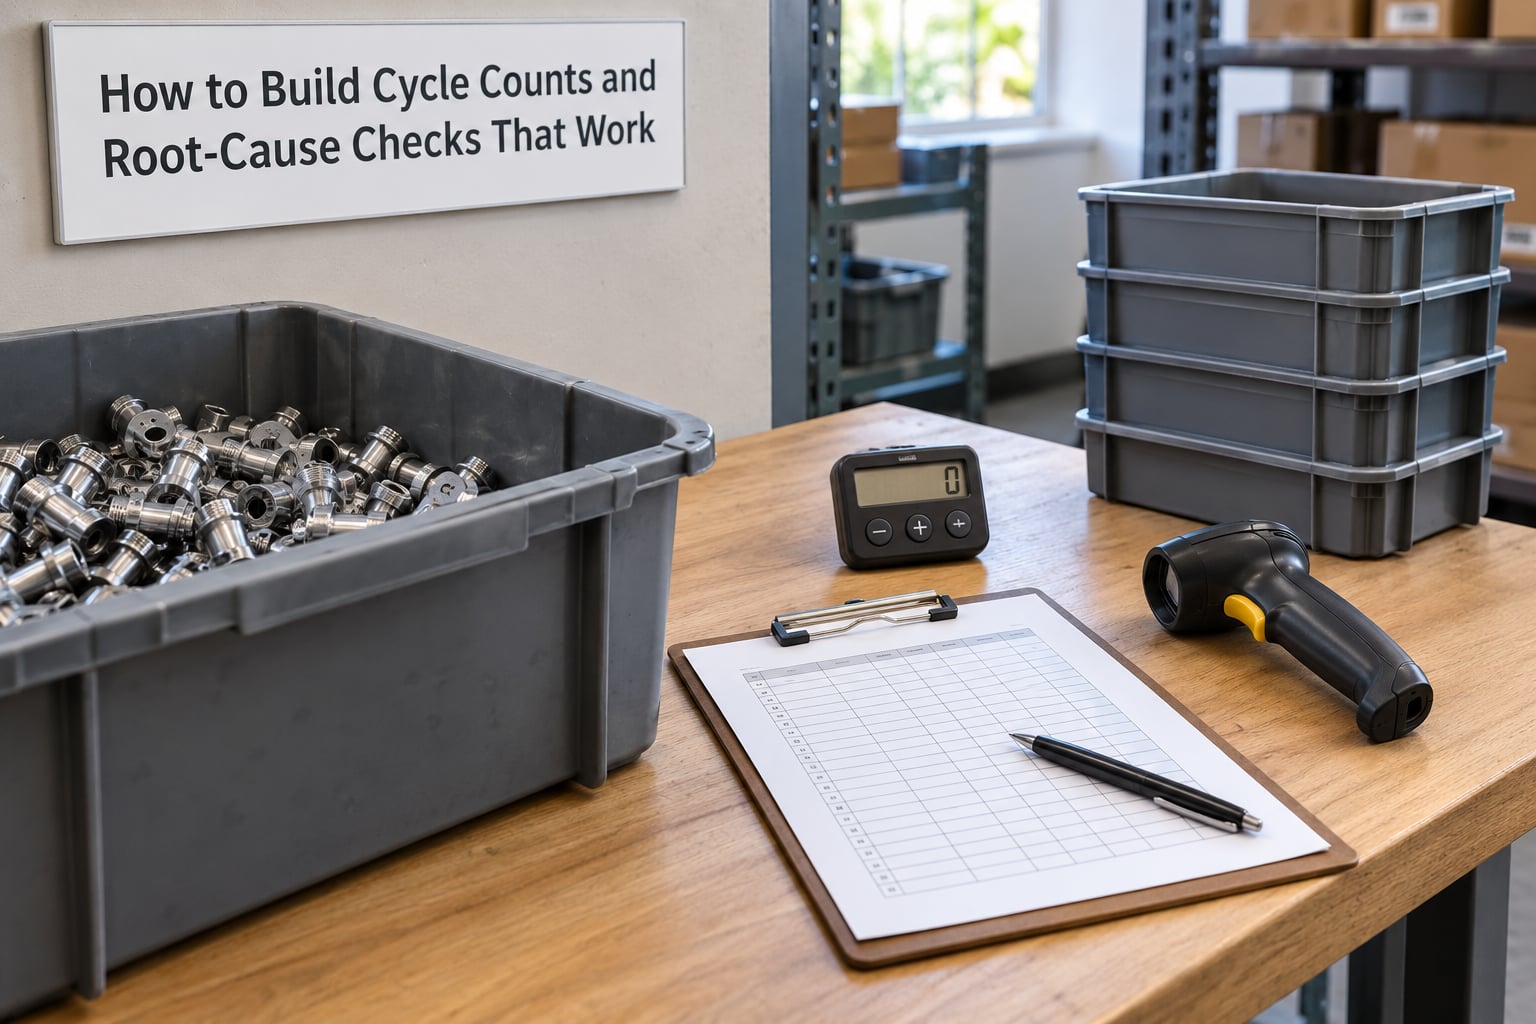
Cycle counting is the control that turns a monthly number into a named cause. The design details matter more than the frequency, and the choice of method is covered in cycle counting vs physical inventory.
How to pick count priorities
Use ABC analysis on value, and layer velocity and risk on top. A class holds roughly 80 percent of the value, B items the next 15, and C items the remainder, so counting effort should follow that curve rather than being spread evenly. ABC inventory analysis explained walks through how to build the classes.
The 80/20 rule people ask about in inventory is the same logic: a small share of SKUs carries most of the value and most of the variance, and those are the ones you count most often. This is also why a full count of everything is usually the wrong first move.
How to run a count that produces evidence
- Freeze movements for the SKUs and locations in the count. A count with picks happening during it is a count of a moving target.
- Count blind. The counter does not see the system quantity. Revealing it first anchors the count to whatever the system says.
- Count locations, not SKUs. A location that matches means everything in that location matched, and it is far faster than a SKU-level sweep.
- Require a second count above a threshold, or for any high-value or serialized item.
- Record the evidence at the time: photos of the bin, the lot number, the seal, the label condition. Evidence captured three weeks later is not evidence.
- Trace the discrepancy to transactions — every receipt, issue, move, and adjustment on that SKU in the count window.
- Escalate repeat losses on the same location or the same item to a formal root-cause review with a corrective action.
Two design flaws quietly destroy count reliability. Unblinded counts and predictable schedules let experienced operators learn when a bin is checked, which raises the count error and lowers the count’s value as evidence. Fix both: blind counts, and a schedule driven by a rule the counter does not control.
Which Metrics Should Managers Track?
Track a small set, review them on a fixed cadence, and give each one an owner. Nine metrics cover the operation well enough to run a program on.
| Metric | What it tells you | Review cadence | Owner |
|---|---|---|---|
| Inventory accuracy | Location-to-location match rate | Monthly | Inventory control |
| Shrinkage rate | Value lost as a share of recorded inventory, on a stated basis | Monthly | Operations manager |
| Count variance value | Dollar value of variances found, split by cause code | Weekly | Inventory control |
| Unrecorded scrap rate | Scrap value as a share of material issued to production | Weekly per line | Production supervisor |
| Receiving-to-putaway time | How long received stock sits unprocessed, an unrecorded-stock proxy | Weekly | Warehouse manager |
| Transaction error rate | Postings later reversed or adjusted, per thousand transactions | Monthly | Finance controller |
| Adjustment value | Total value of inventory adjustments posted in the period | Monthly | Finance controller |
| Repeat-variance rate | Share of SKUs or locations short more than once in a period | Quarterly | Operations manager |
| Days to root cause | Average days from variance found to cause assigned | Monthly | Operations manager |
Set thresholds rather than reacting to noise. A variance under a defined dollar value on a C item is rarely worth the count time. Repeat-variance rate is the metric that tells you whether your fixes are working, because accuracy can stay flat while you slowly change which problems you have.
Frequently Asked Questions
What is the difference between inventory shrinkage and manufacturing scrap?
Shrinkage is stock your system records but cannot find, with no approved transaction explaining the gap. Scrap is material you intentionally discard because it failed a specification, such as a failed batch or start-up purge. Scrap is a planned, recorded cost in cost of goods sold with a cause code. Shrinkage is an accuracy and control problem. Every write-off begins as shrinkage, but scrap is not shrinkage.
How often should a warehouse perform cycle counts to find inventory shrinkage?
Count A items monthly, B items quarterly, and C items annually, then adjust for velocity and risk. Serialized, high-theft, and high-value items belong on the highest cadence regardless of class. Freeze movements for the SKUs being counted, count blind, and reconcile each count within a few days. Monthly cadence catches transactional errors close to the event, which is the only way to trace them to a cause.
Should inventory shrinkage be included in the cost of goods sold?
The accounting treatment varies, so confirm with your accountant, but the common practice is to record shrinkage in cost of goods sold rather than as a separate operating expense. That keeps gross margin comparable across periods. What matters operationally is that shrinkage is tracked separately from scrap and obsolescence in your variance reporting, even when several lines post to the same account. Teams that mix them cannot tell whether the loss is a production problem or an accuracy problem.
What is an acceptable inventory accuracy rate for manufacturers?
Most manufacturing programs treat 95 percent location-level accuracy as a working target and 98 percent as strong, though the right number depends on your SKU count, velocity, and value concentration. Set the threshold where the cost of counting more exceeds the value of the accuracy gained. Track it by ABC class rather than as one blended figure, because a poor score on 40 low-value C items matters far less than the same score on 20 A items.
How can a company reduce shrinkage without slowing operations?
Fix the records before you add friction. Mandatory scans, cause codes on adjustments, and monthly ERP-to-floor reconciliation usually cost no throughput at all, and they identify where loss is actually occurring. Once you know the location, concentrate counts there instead of slowing the whole floor. Freeze movements only for the specific SKUs being counted, keep count teams independent of the picking team, and reserve security hardware for high-risk areas.
Can insurance cover inventory lost through theft or unexplained inventory variance?
Usually theft is covered under standard property and casualty policies, often with a deductible, while unexplained variance often is not. Most carriers require that the inventory be documented and valued, which means count records, cause codes, and an audit trail showing when the loss occurred. Policies vary widely by carrier, limits, and terms, so have your broker confirm coverage and notification timelines. A policy does not remove the accounting requirement to write the loss off correctly.
Conclusion: Start With One High-Risk Inventory Area
The fastest way into inventory shrinkage causes and prevention is to stop trying to fix the whole facility at once. Pick the location where value and variance history overlap, and work that one area end to end.
Choose the area, pull the last 60 days of receipts, issues, moves, and adjustments for its top SKUs, and reconcile them. Run one controlled blind count with movements frozen. Classify the variance against the cause list above, assign a corrective action with a named owner and a due date, then re-count in 30 days to confirm it held. Repeat on the next area.
Inventory shrinkage causes and prevention is a reporting discipline before it is a security problem. Once every loss carries a cause code and an owner, the trend tells you which control is missing.