

If a resin shipment is late, a port closes or a supplier files for bankruptcy, does anyone at your plant know before the line goes down? That is the whole point of supply chain risk management strategies: finding the exposures early, ranking them by what they would actually cost you, and pre-agreeing on the response. The ten strategies below are the ones that hold up in day-to-day manufacturing operations, from injection molding to packaging and warehousing.
I have written this as an operator rather than a consultant. Every strategy includes something you can do this quarter, not a philosophy. Where I have used a number, it is a planning assumption you should replace with your own data.
One warning before we start. Supply chain resilience is not the same thing. Resilience is what your business has after something goes wrong. Risk management is the work you do beforehand to decide what you can live with and what you cannot. The ten strategies here are all risk management work, though several of them build resilience as a side effect.
Table of Contents
- 10 Supply Chain Risk Management Strategies at a Glance
- 1. Build a Risk Register That Ties Risks to Business Impact
- 2. Map Critical Suppliers and Their Dependencies
- 3. Diversify Suppliers Without Creating Quality Drift
- 4. Set Safety Stock Rules for Critical Materials
- 5. Reduce Lead-Time and Lead-Time Variability
- 6. Hold and Manage Strategic Buffer Inventory
- 7. Create Scenario Plans for Disruptions
- 8. Strengthen Supplier Quality and Continuity Monitoring
- 9. Build Flexible Manufacturing and Packaging Capacity
- 10. Use Ongoing Risk Reviews and Leading Indicators
- Frequently Asked Questions
- Can you provide an example of a supply chain risk management plan?
- What are the 5 steps of risk mitigation?
- What is a lean supply chain strategy?
- How do small manufacturers start supply chain risk management on a limited budget?
- What tools are used for supply chain risk management?
- What is the difference between supply chain risk management and supply chain resilience?
- Conclusion
10 Supply Chain Risk Management Strategies at a Glance
The table below pairs each strategy with the risk it targets, the first action to take and where it shows up on a factory floor. Use it to pick where to start.
| Strategy | Risk it addresses | Primary action | Manufacturing use case |
|---|---|---|---|
| 1. Risk register tied to business impact | Unknown exposure | Score likelihood, severity and owner per risk | A single resin grade feeding three top customers |
| 2. Supplier dependency mapping | Single-source and sub-tier blind spots | Map tiers, sites and country concentration | Finding the additive buried inside a compound |
| 3. Diversification without quality drift | Supplier failure | Qualify and audit a qualified backup | Second source for a critical resin or tooling vendor |
| 4. Safety stock rules | Demand and lead-time swings | Set min and max targets per material | Buffering a 45-day resin lead time |
| 5. Lead-time variability reduction | Unreliable promises | Track variance, not averages | Supplier promising 3 weeks, delivering 6 |
| 6. Strategic buffer inventory | Long disruptions | Hold or reserve material beyond safety stock | Bonded stock during a shortage window |
| 7. Scenario plans | No rehearsed response | Write triggers, owners and recovery steps | A 30-day shutdown at your resin supplier |
| 8. Supplier quality and continuity monitoring | Late failure signals | Score OTIF, defects, change notices, finance | Spotting a distressed supplier before insolvency |
| 9. Flexible manufacturing and packaging capacity | Rigid production | Standardize materials, tooling and scheduling | Running the same tool across two machines |
| 10. Ongoing reviews and leading indicators | Stale risk data | Monthly scorecard, quarterly review, annual test | Proving buffer stock actually pays off |
1. Build a Risk Register That Ties Risks to Business Impact

A risk register is just a list, and most lists go stale within a month. What makes one useful is the column that ties each risk to an operational consequence: which machines stop, which customer orders slip, how many days of production are at stake.
Start with seven categories: raw materials, equipment, suppliers, logistics, labor, compliance and customer impact. Then give every line a likelihood score, a severity score, a named owner and a mitigation status. Severity should be expressed in the units your plant understands, such as hours of downtime or weeks of delayed shipments.
If you cannot quantify severity, your register will not survive its first review with finance. That conversation usually goes like this: procurement says a disruption is likely, operations says it would be painful, and finance asks what it costs. A register that already carries downtime and delayed-order numbers answers that question before it is asked.
What a usable risk register row looks like
One real-world example from a packaging converter: natural rubber latex used in a food-contact closure, single supplier in Southeast Asia, 35-day quoted lead time, one customer contract with a penalty clause. Likelihood 3 out of 5, severity 5 out of 5 because two lines would stop. Owner: category manager. Status: mitigation in progress with a second source under audit.
That row takes ten minutes to write. It will still be accurate in six months, which is more than most strategy documents manage.
2. Map Critical Suppliers and Their Dependencies
Supplier mapping answers a question most purchasing teams cannot: if supplier A stops, who else stops? The answer is rarely just supplier A. It is the additive, the masterbatch producer, the tooling shop and the freight forwarder sitting two tiers below your purchase order.
Build the map at site level, not company level. A supplier with three plants in three countries is three exposures, and one of them may be the only one that makes your grade. Map the countries involved too. Concentration is the number that matters: what percentage of your critical materials comes from one country, one port or one region?
Tier-two and tier-three visibility is where most programs stop, and that is where the surprises come from. Practitioners on supply chain forums describe the same pattern repeatedly: a tier-three sub-supplier fails, nobody sees it, and the line goes down two weeks later because the direct supplier had no alternate for that component.
You will not map everything. Map the materials that stop production within 72 hours of running out, then push one level below each of those suppliers. Practitioners who run this exercise report that the second level is where the single-source surprises cluster.
3. Diversify Suppliers Without Creating Quality Drift
Diversification is the most recommended supply chain risk management strategy and the most frequently botched. Add a second resin supplier without controlling specification, tooling, certification and incoming quality, and you have bought a different set of problems: more defects, more trials and more scrap.
The method that works is qualification, not phone calls. Document the specification tightly, including the properties that actually matter to your process: melt flow, tensile and impact, shrinkage, color and any regulatory requirement such as food-contact or automotive approvals. Then run first articles, short trial runs and a defined validation period before the backup carries any volume.
Cost the qualification honestly. Tooling transfers, material trials, test runs and the extra inspection hours all sit on the balance sheet, and a backup supplier that exists only on paper is worthless. Track how much volume each approved backup can realistically absorb, and cap total critical-material coverage where it makes sense rather than chasing every material.
More sources do not automatically mean less risk. Two qualified suppliers in the same country, on the same port and using the same additive supply chain is concentration wearing a disguise.
4. Set Safety Stock Rules for Critical Materials
Safety stock is not a guess and it is not a single company-wide number. It is a rule, applied per material, that you can explain to a scheduler in one sentence.
The inputs you need are average daily consumption, the variability of that consumption, the lead time your supplier actually delivers rather than the one they quote, and the variability of that lead time. Recovery time matters too: how long would it take to switch to an approved alternate source or to bring your own customers down to a sustainable rate?
A workable planning rule for a critical material looks like this: hold enough on hand to cover consumption during your worst observed lead time, plus a recovery allowance, then round the result up to a full order quantity or a full container so you are not paying freight twice.
How to set safety stock rules for the materials that stop your line
Sort materials by line-stoppage impact first, not by inventory value. A low-cost release film that jams a labeling line can outrank a high-value resin in priority. Then apply three tiers: high-impact materials get a full worst-case lead time plus recovery allowance, medium-impact materials get average lead time plus a variability buffer, and low-impact materials run lean with reorder-point triggers.
Review the numbers quarterly. If your real lead time grew, the old buffer is now too small, and nobody notices until the shortage.
5. Reduce Lead-Time and Lead-Time Variability
The most damaging number in most supply chains is not lead time. It is lead-time variability. A supplier averaging four weeks with a range of two to eight is a different operational problem from one delivering five weeks every time, even though the average looks better.
Variability destroys scheduling. It forces larger safety stock, it causes material shortages on the floor, and it turns your production plan into a guess. Track the standard deviation of actual lead time per material, and treat it as a supplier performance metric rather than an accounting footnote.
Four levers move it most: a firm supplier commitment date rather than a shipping date, shared rolling forecasts so the supplier can plan capacity, order sizing that matches the supplier’s run rate so you are not a one-off order, and material readiness standards so a truck is not held at receiving because paperwork is missing.
Reducing lead time and reducing freight cost are related but separate problems. Our lead time reduction guide for manufacturers covers the scheduling and supplier-commitment mechanics in more depth.
6. Hold and Manage Strategic Buffer Inventory
Safety stock covers ordinary variation. Strategic reserve inventory covers the disruption itself: a shortage window, a port closure, a supplier shutdown that runs past your ability to reorder.
The difference matters because you manage them differently. Safety stock is a formula that recomputes itself. A strategic reserve is a deliberate decision with a cost, an owner and a release plan. Decide in advance who is allowed to draw it down, and what triggers the release.
There are several ways to hold it. Bonded or customs-held material gives you control without full ownership cost. Consignment arrangements put material at your site while the supplier owns it until it is consumed. Dual-location inventory splits critical stock across two warehouses or two supplier sites so a single event cannot take all of it. Protective buys during a known shortage window are the crudest version and the easiest to get wrong, because buying in a panic tends to lock in the worst prices.
Whatever the mechanism, write down the release rule before you need it. Reserve material with no stated purpose tends to be consumed quietly by a scheduler trying to hit a date.
7. Create Scenario Plans for Disruptions
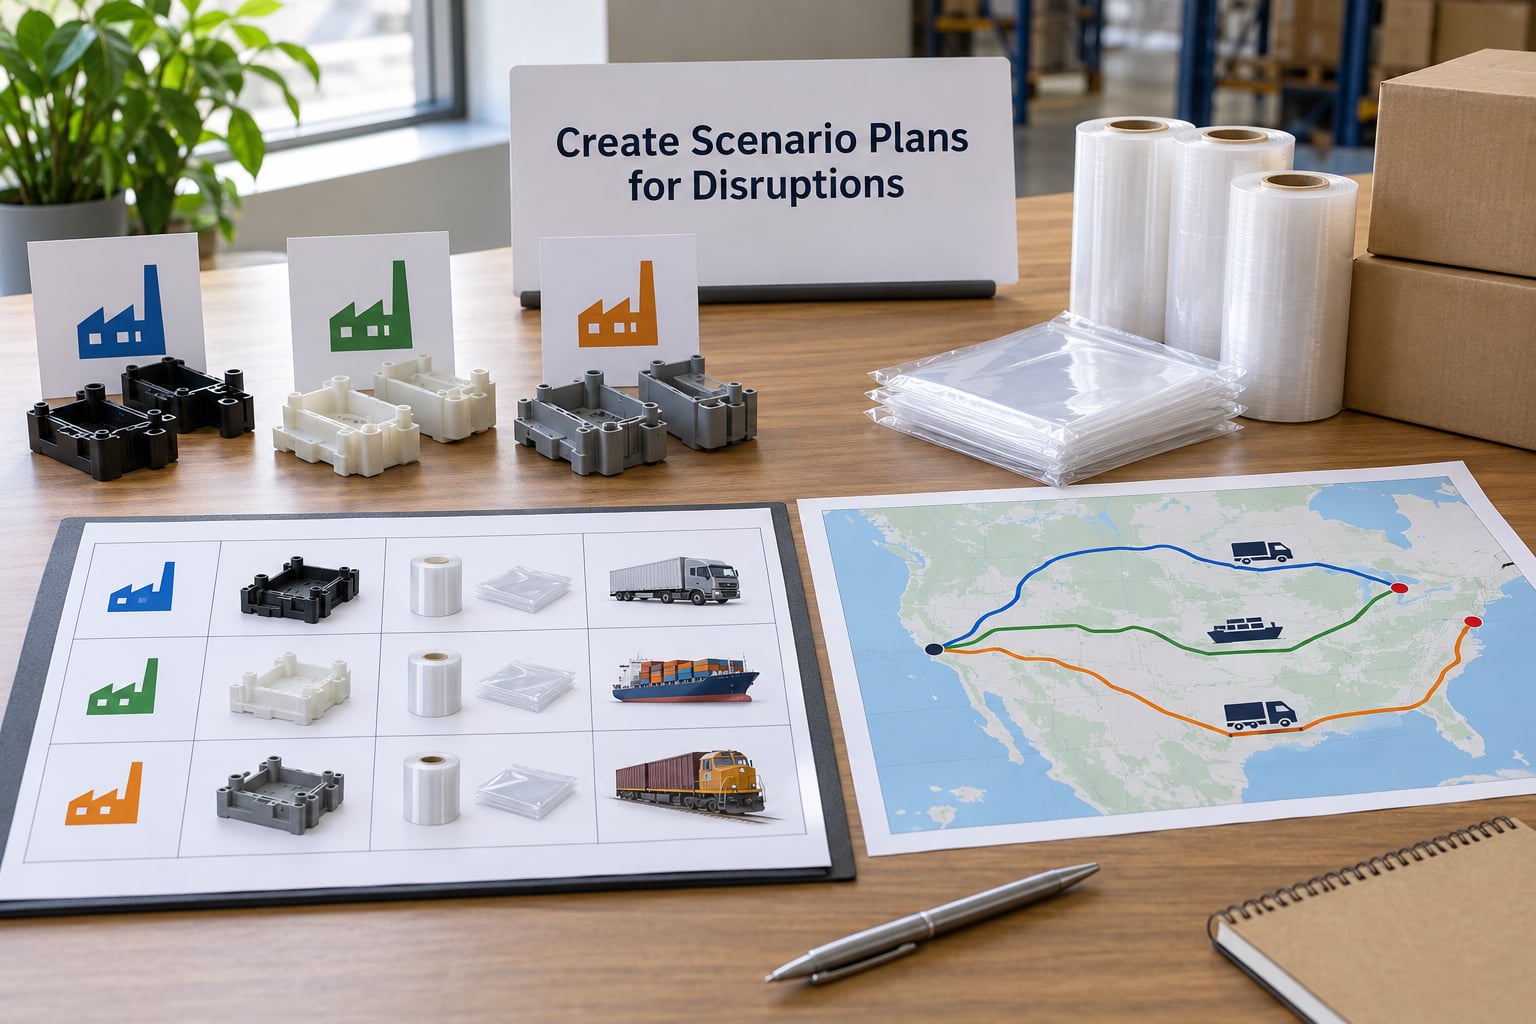
A scenario plan answers one question: if this happens, who calls whom, and what do they do first? Keep it to one page per scenario. The value is in the decisions, not the prose.
Six scenarios cover most manufacturing operations: a supplier shutdown of 30 days or more, port or carrier delay, a resin or resin-grade shortage, a single equipment failure with no spare, a cyber incident at a third-party logistics or ERP provider, and a demand surge that consumes your buffer in under two weeks.
Each scenario needs a trigger, a named response owner, a sequence of recovery actions and a communication path for customers. A trigger should be measurable, such as a confirmed lead time exceeding 21 days on a critical material, not a feeling that things are slipping.
Test one scenario a year. Walk through it as a tabletop exercise with the people who would actually execute it. The gaps you find during the walkthrough are usually in handoffs, not in the plan text.
8. Strengthen Supplier Quality and Continuity Monitoring
Most supplier problems announce themselves early if someone is watching. On-time-in-full performance, defect rates, and slow responses to change requests all trend downward before a supplier misses a delivery.
Build a scorecard with a small number of measures and review it on a schedule. Four usually work: on-time-in-full percentage, incoming defect rate, corrective action closure time, and financial health. On financial health, talk to your credit team, check for late payments patterns, and use the trade credit and credit reporting resources your bank already has. Private credit and supplier bankruptcy filings show up in public records well before they show up in the supply base.
Require formal change notifications in every supply agreement. Resin grade reformulations, additive source changes, plant transfers and capacity expansions all carry risk, and a supplier that tells you early is worth more than one that surprises you quietly.
Run audits where the risk is concentrated, and rely on third-party audit data where it is not. Mature audit programs are consistently linked to better compliance and fewer surprises, and they also give you the documentation you need if a dispute ever comes.
9. Build Flexible Manufacturing and Packaging Capacity
Flexibility is the mitigation that never runs out. Every hour of downtime you can avoid by re-running a job on different equipment is an hour you did not need a backup supplier.
It starts with material standardization. Running two grades instead of five simplifies purchasing, shortens qualification work and makes a switch possible when a supplier fails. Tooling interchangeability does the same thing for equipment: the same tool on two machines turns a single-machine breakdown into a scheduling problem rather than a lost week.
Approved alternate specifications complete the set. Pre-qualify a second specification for each critical part so that when the preferred one is unavailable, production can move without a full engineering cycle. Packaging converters benefit most from this, since film and closure specs can often be adjusted within a qualification cycle of a few weeks.
Capacity reservations and distributed production add another layer. Reserving a slot at a second processor costs money in a good year and is worth far more in a bad one.
10. Use Ongoing Risk Reviews and Leading Indicators
Ongoing supply chain risk management strategies work as a cycle, not a document. Once the register exists, the work becomes measurement: track a small set of leading indicators and review them on a fixed schedule with the people who can act on them.
The metrics that show your supply chain risk management strategies are working
Track these six. They are enough to tell you whether the program is doing anything.
- Supplier risk coverage: the percentage of your critical materials with a qualified second source.
- Lead-time variability: standard deviation of actual lead time per material, trending by supplier.
- OTIF performance: on-time-in-full percentage per supplier, reviewed monthly.
- Forecast accuracy: how far your own demand plan sits from actual consumption.
- Inventory days on critical materials: measured against the buffer rule you set, not against a corporate average.
- Recovery test results: how long the last scenario exercise actually took end to end.
Hold a monthly operations review and a quarterly leadership review. The monthly meeting is about the numbers. The quarterly one is about the register: add new risks, close resolved ones, and re-score anything the indicators have moved.
If leadership asks why the program needs budget, bring the recovery test result and the number of days you covered during the last disruption. Practitioners on supply chain forums say the same thing about getting that meeting: bring a value-stream or dependency map, not an opinion.
Frequently Asked Questions
Can you provide an example of a supply chain risk management plan?
A workable plan for a mid-size injection molder looks like this. First, they list the four materials that would stop a line within 72 hours and score each for likelihood, downtime and customer impact. Second, they map every source and one tier below each source, flagging single-source and single-country exposure. Third, they set safety stock rules per material using actual lead-time variability rather than quoted lead time. Fourth, they qualify one alternate resin for the top two materials and document the specification. Fifth, they write a shutdown scenario with a named owner and a 21-day lead-time trigger. Sixth, they review the register quarterly against OTIF, defects and recovery test results.
What are the 5 steps of risk mitigation?
The five steps are: identify the risks, assess each one for likelihood and severity, prioritize by exposure, apply a mitigation matched to that specific risk, and monitor with defined indicators. The step most programs skip is the third, because prioritization requires an honest view of downtime and revenue at stake. Mitigation also has to match the risk. Diversification answers a single-source problem, buffer inventory answers a long lead-time problem, and a force majeure clause answers a contractual problem.
What is a lean supply chain strategy?
A lean supply chain strategy minimizes cost and inventory by producing and delivering only what is needed, when it is needed. It works well when demand is predictable and lead times are reliable, and it becomes fragile when either assumption breaks. The usual compromise is lean with a defined buffer at the points where disruption is most expensive, rather than buffers everywhere. That keeps most of the cost advantage while removing the single line-stoppage risk.
How do small manufacturers start supply chain risk management on a limited budget?
Start with a spreadsheet and one page. List the materials that would stop a line within 72 hours, score them, and map the suppliers plus one tier below. Then measure actual lead-time variability for those materials, which costs nothing beyond pulling receiving history. That single measurement usually justifies the program better than any other exercise. Software can wait. Teams that buy a control tower before they know their exposure end up with a dashboard nobody trusts.
What tools are used for supply chain risk management?
Four categories cover most needs: supplier relationship management systems that hold qualification and performance data, early warning services that scan news, financial filings and shipping data for signals, network mapping tools that visualize tiers and routes, and analytics layered on ERP data for scenario modeling. Spreadsheets remain genuinely useful for the first 90 days because they force clarity about which materials actually matter. The deciding factor is data quality: poor master data undermines every dashboard built on top of it.
What is the difference between supply chain risk management and supply chain resilience?
Risk management is the work done before a disruption: identifying exposures, scoring them and deciding what to do about each one. Resilience is the ability to absorb a disruption and keep operating once it happens. Risk management is what generates resilience, because buffer stock, qualified alternates and rehearsed scenarios only help if they were decided in advance. Operations leaders tend to blur the two words, so it helps to ask which phase a proposed project belongs to before funding it.
Conclusion
Supply chain risk management strategies only pay off once they live in a register someone owns. Pick one material that would stop a line within 72 hours, map its suppliers and one tier below, measure how much its lead time actually varies, set a trigger for when to act, and walk the team through the alternate plan once. That sequence takes a couple of weeks and gives you a register, a buffer rule and a tested scenario you can extend to everything else.
Once the register is running, tighten it. Freight is often where the buffer pays for itself fastest, so our freight cost reduction strategies for manufacturers are worth reading alongside strategy 6.