
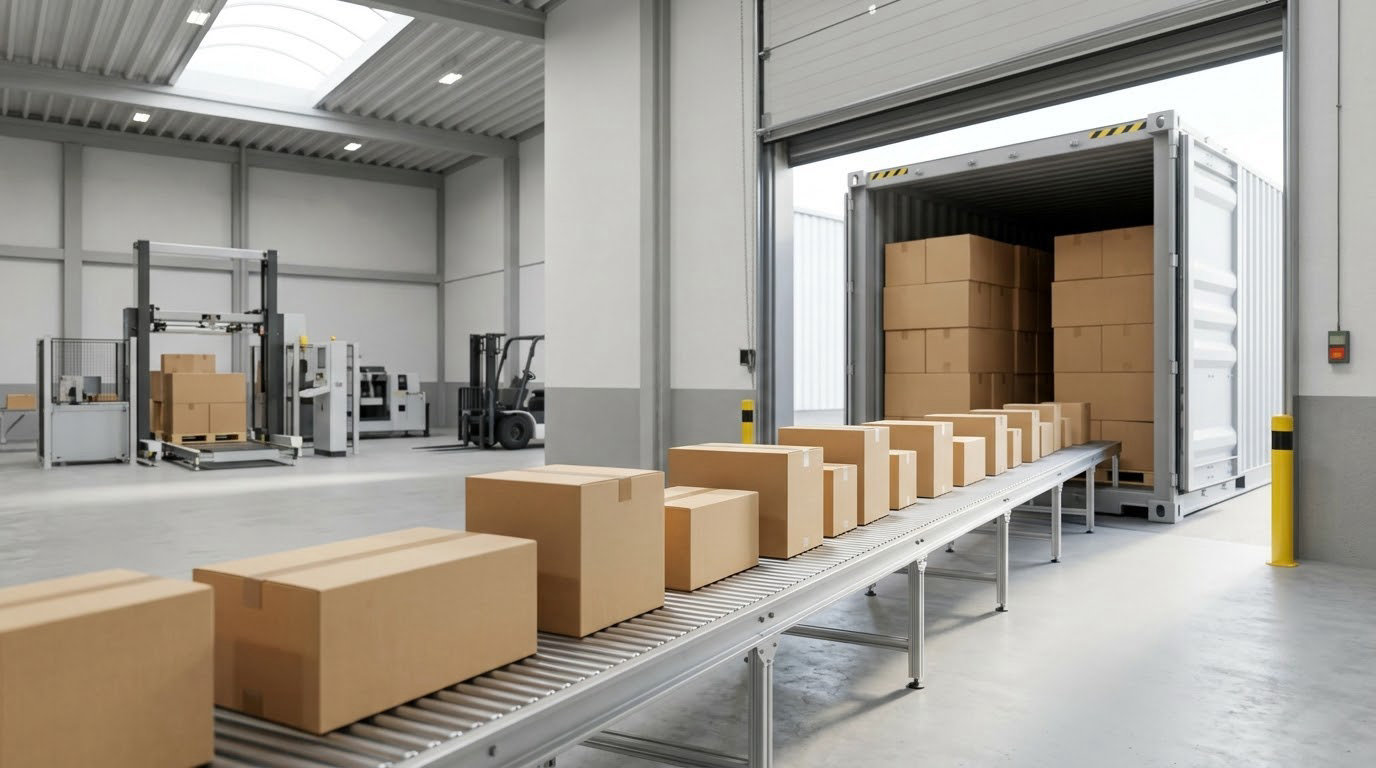
Freight cost reduction strategies for manufacturers come down to one habit: measure the whole invoice, not the quoted rate. Between 60% and 80% of a manufacturing freight bill is linehaul, and the rest — fuel, accessorials, reclassification, terminal handling, detention — holds most of the recoverable money. In 2026, fuel surcharge alone commonly adds 12% to 28% on top of the base rate, and accessorial charges for liftgate, residential and limited-access deliveries can add another 10% to 30%.
That is why the biggest wins rarely come from demanding a lower base rate. They come from right-sizing the mode, redesigning the pallet, batching the orders, fixing the freight class, and going back over invoices line by line. The framework below walks through each one, in the order that produces cash fastest.
Table of Contents
- How Can Manufacturers Reduce Freight Costs Without Increasing Risk?
- What Data Should You Analyze Before Changing Freight Spending?
- Which Freight Cost Reduction Strategies Deliver the Fastest Savings?
- How Do You Negotiate Better Manufacturing Freight Rates?
- How Can Packaging and Load Design Lower Freight Costs?
- How Can Manufacturers Consolidate Shipments and Improve Backhauls?
- How Do Freight Audits and Invoice Controls Prevent Hidden Charges?
- How Do You Choose Between Outsourcing Logistics and Managing Transport In-House?
- What KPIs Prove Freight Cost Reduction Is Working?
- Frequently Asked Questions
- What is the easiest way for a manufacturer to reduce freight costs?
- How much can freight cost reduction strategies save a manufacturer?
- Should manufacturers negotiate directly with carriers or use a freight broker?
- How often should a company conduct a freight audit?
- Can reducing freight costs increase packaging damage or delivery times?
- Conclusion
How Can Manufacturers Reduce Freight Costs Without Increasing Risk?
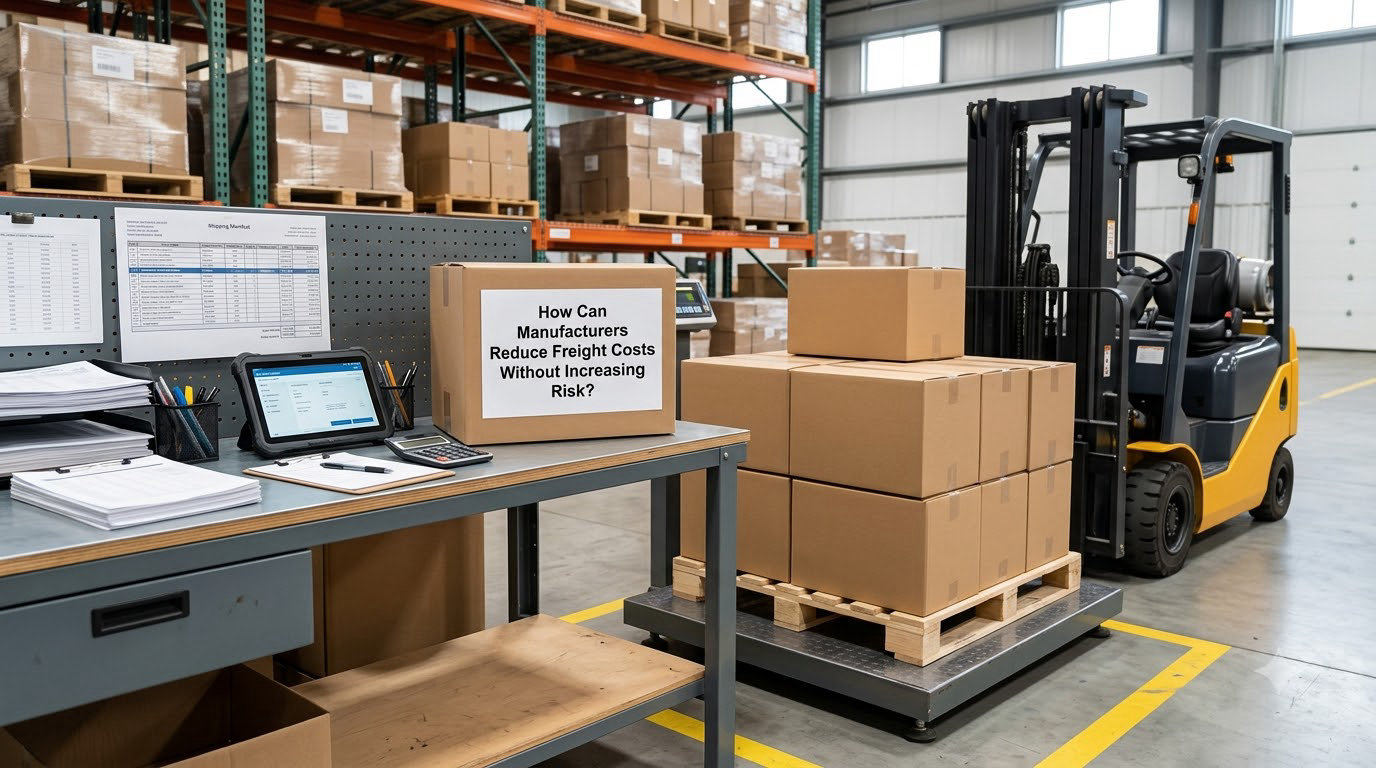
Reduce the total transportation cost per shipped unit while holding service, damage and inventory performance steady. A lower linehaul rate that comes with missed appointment windows or a higher damage rate is not a saving, it is a transfer from freight to chargebacks and production downtime.
It helps to break the freight bill into five buckets, because each one responds to a different lever:
- Linehaul. The base rate for the move, driven by lane balance and capacity. Mostly market-driven, but you influence it with volume commitments, seasonality and contract structure.
- Surcharges. Fuel, peak season and equipment imbalance charges, usually percentage-based on the linehaul. Manage them with caps and index links, not by hoping.
- Accessorials. Liftgate, residential delivery, limited access, inside delivery, appointment scheduling and notification fees. These are the fastest lever and the most commonly overlooked.
- Packaging and dimensional weight. What the piece actually weighs versus what it bills as. Dense loads are cheap loads.
- Exceptions. Reweigh, reclassification, detention, demurrage, layover and claims handling. Small individually, expensive in aggregate.
Reclassification is the one that stings most. When a carrier reweighs a shipment and re-rates it, the bill can grow 10% to 20%, and the charge arrives weeks after the shipment with a reclassification fee attached. Getting the freight class and NMFC item right the first time removes an entire category of dispute.
Then set the guardrails before you start. Track freight cost per unit, accessorial charges as a share of spend, damage rate, detention hours, on-time-in-full performance and the inventory cost of any change in delivery frequency. A program that cuts cost per shipment but pushes safety stock up two weeks has moved the money, not removed it. For most manufacturers working to big-box retail customers, MABD and OTIF scorecards are the line that decides whether a cheap rate was actually cheap.
What Data Should You Analyze Before Changing Freight Spending?
You cannot negotiate what you have not measured. Pull twelve months of invoice detail and rate confirmations, and build a lane-level baseline before any conversation with a carrier or broker.
For every shipment, capture: origin and destination ZIP codes, mode, number of pieces and pallets, actual weight, dimensions, freight class and NMFC item, quoted rate, billed rate, every accessorial line, tender acceptance, on-time status, and damage or claim history. Six months of clean data beats twelve months of inconsistent data, so pick one format and stay with it.
Next, classify the shipments by flow type, because the levers differ:
- Inbound raw material and resin. Bulk, heavy, often FTL. Lever: contract capacity and backhaul.
- Inbound components. Smaller, mixed, often parcel or LTL. Lever: vendor consolidation and cube.
- Inter-plant and work-in-progress transfers. Lever: backhaul and backhaul-empty prevention.
- Outbound finished goods to distribution centers. Lever: cartonization, freight class, consolidation windows.
- Store replenishment and direct-to-retail. Lever: MABD discipline and appointment accuracy.
- Returns. Lever: consolidation and recovery value.
Then rank lanes by spend multiplied by variance opportunity, not by spend alone. A lane at $400k a month with clean invoices is less interesting than a $90k lane billing 25% above its quote. The same logic applies to part-level analysis: for molded components, part weight and unit cost drive the landed cost far more than the carrier rate does, so a weight-versus-price comparison like this 3D printing vs injection molding cost breakdown often tells you more about freight exposure than another rate quote will.
Finally, split costs into what you control and what the market sets. Base linehaul and fuel index movement are market. Class accuracy, packaging, accessorials, mode choice, invoice errors and consolidation are yours. Managers on supply chain forums keep circling the same problem: finance wants a savings target in dollars, and the team has run out of levers beyond rate negotiation. The controllable column is where the answer is.
Which Freight Cost Reduction Strategies Deliver the Fastest Savings?
Ranked by how quickly the money lands. Effort assumes a manufacturing team with a TMS or at least a decent shipment log, not a dedicated analytics department.
| Strategy | Effort | Typical savings potential | Operational risk | Best fit |
|---|---|---|---|---|
| Right-size the mode (LTL, FTL, box truck, parcel) | Low | 5% to 15% on affected freight | Low | Partial loads shipping full-truckload rates |
| Accessorial control | Low | 3% to 8% of total spend | Low | Residential and limited-access customer mixes |
| Freight class and NMFC correction | Low | 2% to 5% | Low | Diverse finished-goods portfolios |
| Shipment consolidation and order batching | Medium | 8% to 30% on consolidated freight | Medium | Many small orders leaving one site |
| Backhaul recovery and zone skipping | Medium | 3% to 10% | Medium | Dedicated fleets and inter-plant flows |
| Carrier contract negotiation | Medium | 5% to 15% | Medium | Multi-site manufacturers with steady volume |
| Invoice audit and recovery | Low to medium | 2% to 5% recovered | Low | Any operation shipping more than a few loads a day |
| Packaging and load engineering | Medium | 2% to 8% | Medium | Lightweight parts shipped in oversized cartons |
| Network redesign and technology | High | 5% to 15% over 12 to 24 months | High | Multi-DC networks or fragmented supplier shipping |
Quick wins land in the first 30 days: mode right-sizing, accessorial discipline, class correction and an invoice review of the last quarter. Medium-term work between 30 and 90 days covers consolidation windows, packaging pilots and contract negotiation. Structural moves — network redesign, a TMS, a 3PL transition — take six months to two years and need capital approval.
One caution from people running these programs: multi-node and split-load strategies look attractive on a spreadsheet and then add touchpoints, dock scheduling, email volume and coordination headcount. They pay off when you have density. Without density, every extra handoff adds cost you did not budget.
How Do You Negotiate Better Manufacturing Freight Rates?

Prepare a proposal by lane, not by asking for a blanket percentage off. A carrier can decline 8% across the board and still give you 15% on your top five lanes if you hand them the volume and the lane detail.
Build the packet with twelve months of lane-level shipments, weight and class mix, accessorial history per lane, seasonality shape, current contract terms and your own service commitments. Then ask for specific things:
- Base rate changes by lane, matched to what you actually tender.
- Fuel surcharge caps or index mechanics you can predict, so budgeting is not a guess.
- Peak season and equipment imbalance triggers with defined windows.
- All-in versus itemized accessorials. Itemized lets you audit; all-in simplifies but can hide expensive exception charges. Ask for both and compare.
- Per-pallet or per-stop pricing where your shipments are consistent in shape.
- Guaranteed capacity during peak weeks, and a named escalation contact.
Put alternatives on the table. A dedicated fleet, an intermodal option for long-haul lanes, a regional carrier for short hauls, or a milk-run schedule to a nearby DC can each beat a spot-market LTL quote. Price the whole thing though, including the transload and the extra handoff.
Consider a carrier portfolio rather than a single award: a primary carrier taking most volume, a secondary for capacity and leverage, and a small spot allocation tested continuously. One global electronics manufacturer reported a three-carrier split with roughly 60% primary, 30% secondary and 10% spot volume, paired with 23% lower cost and 99.2% on-time performance. Treat that as a shape worth testing, not a promise.
Then close the loop. Put the agreement into a carrier scorecard reviewed monthly: on-time pickup and delivery, damage rate, claim resolution days, accessorial accuracy and rate compliance against contract. An agreement that promised a lower rate and then billed accessorials you never agreed to has not saved anything.
How Can Packaging and Load Design Lower Freight Costs?
Freight is billed on the greater of actual weight and dimensional weight, and for anything shipped LTL or parcel that second number is usually the expensive one. Our worked example: a standard 48 by 40 by 36 inch pallet is 69,120 cubic inches. Divided by a typical LTL factor of 139, that bills as 497 pounds — nearly 40 hundredweight — whether the pallet weighs 900 pounds or 2,200.
That gap is where packaging redesign pays. The mechanics that matter:
- Cube utilization. Measure empty space inside every shipped carton. High void ratios mean you pay to move air.
- Cartonization and right-sizing. Size cartons to the part, not to the pallet pattern you have always used. Small parts in oversized boxes is the single most common waste I see.
- Pallet pattern and floor space. Standard patterns that tile a trailer floor with no dead space move more product per load. Half-pallets and quarter-pallets matter when your order quantities are odd.
- Pallet quality. Broken boards slow loading, invite damage and can trigger a rejection. Slip sheets and corner boards cost little and reduce hand injuries.
- Protective materials. Foam and dunnage are cheap compared with a damaged part or a freight claim you cannot prove.
- Load stability. Blocking, banding and correct stacking prevent shifting in transit. A load that arrives intact does not get re-rated, re-handled or re-claimed.
Packaging also shapes the freight class. NMFC item descriptions, packaging count and density feed the classification, so a packaging change can move a shipment into a lower class. That is a good argument to run packaging and classification review together rather than as two separate projects. The mechanics of the dimensional math are laid out in our guide to how to calculate packaging dim weight cost.
Test changes on real data. Pull one quarter, compute billed hundredweight versus actual hundredweight by SKU family, and pilot the two worst offenders. Most plants find that a handful of SKUs carry most of the cube penalty.
How Can Manufacturers Consolidate Shipments and Improve Backhauls?
Consolidation is where manufacturing freight gets structurally cheaper, and it is also where it gets operationally messy. The levers, roughly in order of payoff:
- Order batching and wave planning. Hold non-critical orders for a cutoff and ship one full load instead of three partial ones. Watch customer lead-time promises and safety stock before you set the cutoff.
- Inbound vendor consolidation. The most overlooked lever in manufacturing. Ask suppliers to route through a common carrier, deliver to a consolidation point, or build full loads against a published routing guide. Suppliers who ship partial truckloads to your dock are the reason your inbound cost per hundredweight looks strange.
- Cross-docking versus terminal networks. A cross-dock moves freight through one or two handoffs instead of three to five, which cuts both handling charges and transit time. The math favors it when your volume per lane is dense enough to fill the outbound leg.
- Pool distribution and zone skipping. Inbound freight moves at bulk rates to a central point, then sortation pushes product to regional destinations, skipping the expensive terminal hop. Good for high-volume multi-region distribution.
- Backhauls. Plan the return leg before the outbound: where the truck has to be next, and whether a partial load, a maintenance run or a supplier pickup can fill it. An empty return leg is a full-rate cost for zero revenue.
- Returns and rekit. Consolidate returns onto scheduled routes rather than shipping them individually at whatever rate the carrier quotes that day.
Consolidation has a documented ceiling. Industry reports put the savings range at 18% to 30% annually on the freight you actually consolidate, which is a large number precisely because it applies only to a portion of your book. Plan inventory and service effects into the business case, not around them.
For component flows specifically, the freight decision often belongs upstream. Tooling amortization and part weight set the inbound cost structure long before a carrier quote does, and that is worth modeling before you commit volume; our piece on how to calculate injection molding tooling cost covers that side of the ledger.
How Do Freight Audits and Invoice Controls Prevent Hidden Charges?
A freight audit is a line-by-line comparison of the invoice against the rate confirmation, the contract, the bill of lading and the packing slip. Manufacturers routinely find that 8% to 12% of freight spend is billed above what was agreed, mostly in small charges that nobody reads closely.
Know the invoice anatomy before you start. Every LTL invoice carries a rated line, a fuel surcharge, a stack of accessorials, and sometimes exceptions layered on top:
- Rated line computed from class, weight or DIM, and hundredweight.
- Fuel surcharge applied as a percentage of the rated line.
- Accessorials: liftgate or liftgate service, residential delivery, limited access, inside delivery, appointment scheduling, notification, driver assist.
- Exceptions: reweigh, reclassification, detention, demurrage, layover, redelivery.
The four checks that catch most of the money: weight and class against the shipment file, dimensions against the packaging spec, accessorial validity against the delivery address and appointment, and rate compliance against the contract grid. A liftgate billed at both ends for one residential delivery is a classic. So is an appointment fee charged on a delivery that arrived inside the free window.
Then put controls in place, because recovery without control is a one-time event. Pre-pay or pre-audit approval before the invoice enters accounts payable, a standing recovery process with credit requests, and a recurring review that compares every line against the previous quarter. Keep claims management in the same loop: file damage claims fast with photos and proof of delivery, because claim recovery is a freight cost line like any other.
Technology benchmarks put transportation management system implementation savings at roughly 8% to 10% once data is clean, though the real gain is reconciliation speed. Even a spreadsheet handled consistently beats an inbox.
How Do You Choose Between Outsourcing Logistics and Managing Transport In-House?
There are three workable models, and most manufacturers end up with a hybrid. The deciding factors are volume, complexity and whether you can hold onto good people.
- Broker-led, transactional. You tender, the broker shops rates, you audit invoices yourself. Lowest overhead, most volatility, weakest control. Fine below roughly a handful of loads a week.
- 3PL partnership. The 3PL takes freight execution, carrier management, claims and often warehousing, and reports against a scorecard. Industry studies put average logistics cost reductions for 3PL users around 9%. You trade margin for scale, buying lanes, technology and people you would not otherwise be able to hire.
- In-house transportation. You buy capacity, manage carriers, run the TMS and own the data. Highest control and best carrier relationships once you have scale, and the highest fixed cost. Weakest fit if your volume swings hard with seasonality.
Ask a few questions before you decide. How many shipments leave each site per week? How many distinct lanes? Do you serve big-box retail with MABD and OTIF obligations that need dedicated expertise? Can you recruit and keep a transportation manager and a planner? Do you have the systems to manage carrier contracts, or will that person spend all day on spreadsheets?
Whichever you pick, hold the partner to measurable terms: monthly scorecards, audit rights, data ownership, surcharge transparency, and a named escalation path. Ask about the 3PL’s own carrier financial health before you commit, since carrier failure shows up as your service failure. Many companies run in-house for inbound plant and supplier flows, where control matters most, and hand outbound to a 3PL. That split works more often than a single answer.
What KPIs Prove Freight Cost Reduction Is Working?
Track a small scorecard monthly. Too many metrics and nobody reads them.
- Freight cost per unit shipped and per hundredweight. The output measure. Watch for savings that come from shipping less product, not from shipping it better.
- Accessorial charges as a percentage of total spend. Should fall visibly once appointment and delivery data is clean.
- DIM exposure. Billed hundredweight versus actual hundredweight, by lane and SKU family. This is your packaging scorecard.
- Average shipments per load and tender acceptance rate. Rising consolidation and high acceptance together mean your rates match your freight.
- On-time delivery, on-time-in-full and MABD misses. The guardrail. If cost per unit drops while OTIF falls, the trade is not real.
- Damage and claims rate, plus days to resolve a claim. Cheap packaging shows up here before it shows up in the credit memo.
- Detention and reclassification charges. Both should trend toward zero. If they do not, the cause is upstream in packaging or classification accuracy.
- Inventory impact. Days of supply and cycle stock in the lanes you changed. Consolidation should not quietly buy freight savings with excess inventory.
Review the cost metrics monthly and the service metrics monthly alongside them, never separately. Re-benchmark your rates annually or when volumes shift materially, and re-run the packaging review every time a part or a carton changes. Savings programs decay quietly, and the scorecard is what tells you.
Frequently Asked Questions
What is the easiest way for a manufacturer to reduce freight costs?
Start with the two levers that need no capital and no contract change: right-size the mode on every lane, and control accessorial charges. Many plants ship full-truckload rates on partial loads and pay liftgate and residential fees they never planned for. Once those are clean, move to freight class accuracy, invoice auditing, then consolidation and packaging.
How much can freight cost reduction strategies save a manufacturer?
Realistic first-year savings land between 5% and 12% of freight spend for a program that covers auditing, accessorial control, class accuracy and mode right-sizing. Broader programs that add consolidation and network work can reach the higher end, and industry reports put consolidation alone at 18% to 30% on the freight you actually consolidate. The number that matters most is the share of spend you can measure lane by lane.
Should manufacturers negotiate directly with carriers or use a freight broker?
Use a broker when volume is thin or lanes are unpredictable, since carriers set the terms for small shippers. Negotiate directly once you have steady volume on specific lanes, a clean twelve-month shipment history and someone who can hold carriers to a scorecard. A hybrid often works best: direct for major lanes where you have leverage, broker for everything variable.
How often should a company conduct a freight audit?
Run a full audit every quarter and a targeted review of your top ten lanes every month. Quarterly catches the annual rate change, the seasonal accessorial pattern and the contract clauses you may have missed. Monthly lane reviews catch errors early, which matters because most carriers require claims within a limited window. Keep payment approval tied to the audit so errors never reach the ledger.
Can reducing freight costs increase packaging damage or delivery times?
Yes, if the change is made on the rate sheet alone. Consolidating orders means longer waits before a shipment leaves, and right-sizing cartons can remove the void fill that was protecting parts. Both are manageable: publish new lead times to customers, and compression-test the revised packaging before you roll it out. Track damage rate and on-time delivery alongside cost from the first month.
Conclusion
Start with the baseline, because twelve months of lane-level invoice data is what makes everything after it credible. Next, stop the leakage: audit recent invoices, fix freight class accuracy, and take accessorials apart line by line.
Then work on the physical shipment. Right-size the mode, redesign the cartons and pallet patterns, and batch orders into full loads with an eye on inventory and lead times. With clean data and better freight, go back to carriers and negotiate lane by lane, with surcharge caps and a scorecard attached.
Network changes come last because they are the ones that cannot be undone quickly. In 2026, the manufacturers getting real margin out of freight are the ones that treat the invoice, the carton and the contract as one system, and review the numbers every month.