

Building an FMEA for injection molding processes means walking every stage of the molding cycle, naming the ways each stage can go wrong, scoring the harm, the frequency and the chance your current controls catch it, then fixing the rows that score worst. It is a workshop, not a form, and for a molding line it usually takes one day to build and a day a year to keep honest.
Most molding teams already have the raw material. What they lack is the structure that turns a pile of defect complaints into a ranked list of engineering changes. That is the gap this guide closes.
Table of Contents
- What You Need
- What FMEA Is and the Five Steps Behind It
- Step-by-Step: How to Create an FMEA for Injection Molding Processes
- 1. Define the Injection Molding Process and Boundaries
- 2. Build the Process Flow and Function List
- 3. Identify Failure Modes and Effects
- 4. Identify Causes and Prevention Controls
- 5. Score Severity, Occurrence, and Detection for Molding Defects
- 6. Calculate the RPN and Set Action Priorities
- 7. Define Detection Measures and Corrective Actions
- 8. Review and Revise the FMEA After Validation
- Common Mistakes
- Frequently Asked Questions
- Conclusion: Where to Start
What You Need
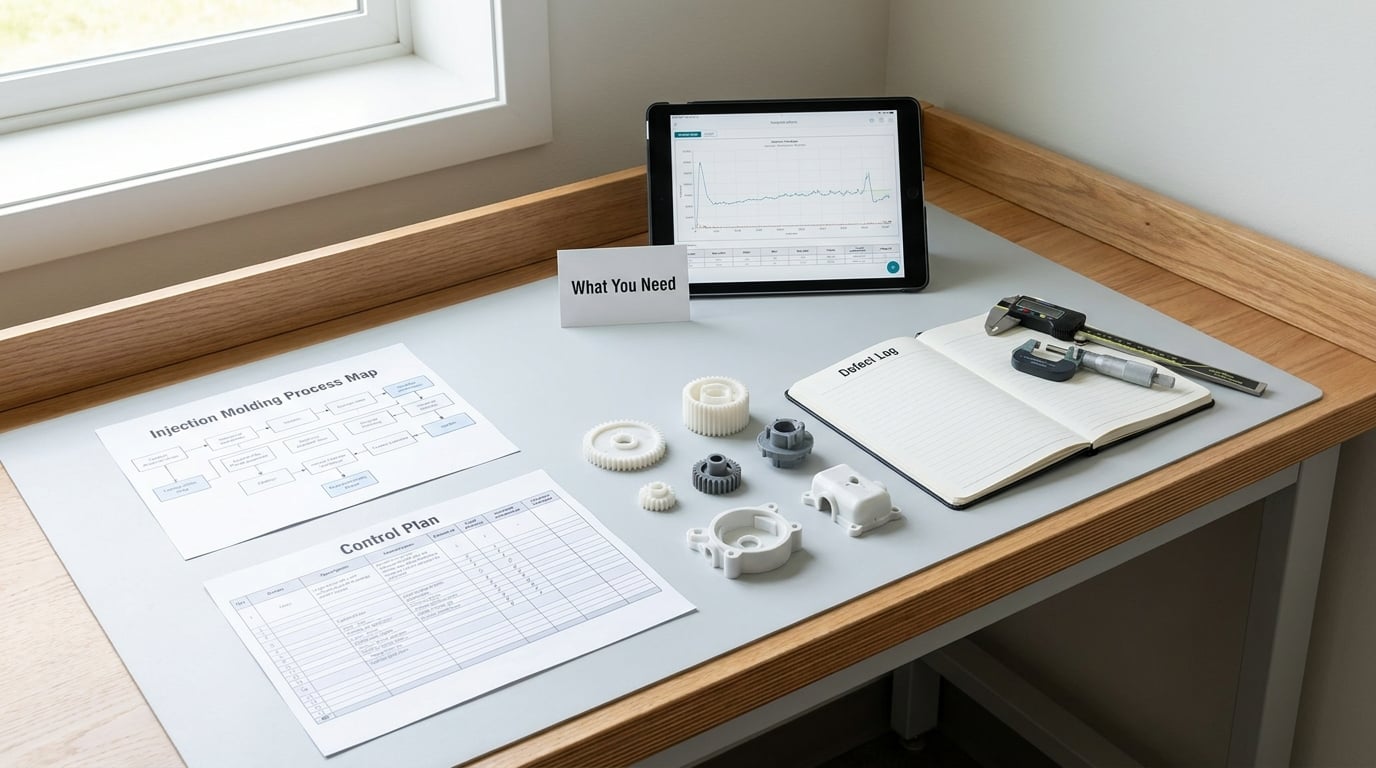
Gather these before you book the meeting. Missing one of them is the usual reason an FMEA workshop turns into an opinion session.
- A process flow diagram for the specific part. Not a generic molding cycle diagram. Number the steps the way your cell actually runs them, because that numbering has to match the Control Plan later.
- The current process parameter sheet. Barrel zone temperatures, melt temperature, screw speed, fill time, hold pressure, hold time, cooling time, clamp force, back pressure, cushion size.
- Twelve months of defect data. Scrap records, rework logs, customer complaints, the 8D reports you have closed, and the last-shot inspection notes.
- The Control Plan and the PFMEA or DFMEA it descends from. You are updating, not starting from a blank page, unless this is a brand new part.
- Material and equipment specifications. Resin data sheet, drying recommendation from the supplier, machine tonnage and shot capacity, mold construction notes, and the list of special characteristics on the drawing.
- A cross-functional team. A process engineer, a quality engineer, a production lead who runs the machine, a tooling or maintenance representative, and someone from design if the part has cosmetic or sealing faces.
Add capability data if you have it. Cpk or at least a scrap rate and defects per million for the last three months is what separates a defensible Occurrence rating from a guess.
What FMEA Is and the Five Steps Behind It
An FMEA is a preventive risk analysis. For each step of a process you document how it can fail, what that failure does, what causes it, what controls exist today, and how urgent the problem is. FMEA stands for Failure Mode and Effects Analysis, and the name now covers a whole family of documents rather than one specific sheet.
| Type | What it analyses | When you use it on a molding part |
|---|---|---|
| Design FMEA (DFMEA) | The product design, before the tool is cut | Confirms the part can physically be molded at all, and flags geometry that guarantees sink or warpage |
| Process FMEA (PFMEA) | The manufacturing and assembly process | The core document for a molding cell, and the subject of this guide |
| Interface FMEA | Interfaces between parts or suppliers | Your mold versus the incoming insert, or the molded part versus the assembly fixture |
| Concept or Functional FMEA | Early design intent and function | Rarely used in a molding shop, mostly in product development |
So the difference between a PFMEA and an FMEA is a matter of scope rather than method. An FMEA is the analysis. A PFMEA is the one that asks how your process can produce a part that does not meet specification.
The five steps of FMEA are the same whatever the industry:
- Prepare. Assemble the team, the process flow and the historical data, and write down scope, assumptions and special characteristics.
- Identify failure modes and effects. For every process step, ask what can go wrong and what the result is for the part, the tool, the equipment, the operator and the customer.
- Identify causes and existing controls. For each failure mode, list the process parameters, material conditions, tool features and human actions that produce it, and the controls already in place.
- Score and prioritize. Rate each failure mode for Severity, Occurrence and Detection from 1 to 10, then derive an Action Priority.
- Act and re-score. Assign an action, an owner and a date to every high-priority row, implement it, and re-rate Occurrence and Detection to show the residual risk dropped.
Step 5 is the one that gets skipped, and it is the one an auditor opens first.
Step-by-Step: How to Create an FMEA for Injection Molding Processes
1. Define the Injection Molding Process and Boundaries
Write the scope block before anything else: part number and name, resin and grade, mold identification and cavity count, annual and peak volume, number of shifts, and the customer. State what is out of scope, such as incoming resin inspection or downstream assembly, so nobody argues about those rows later.
Mark the special characteristics on this part explicitly. A sink mark on a cosmetic housing is a visual defect. The same sink mark on a sealing face is a leak path and a customer line stop. Same geometry, different severity, and only the scope block tells you which one you wrote.
2. Build the Process Flow and Function List
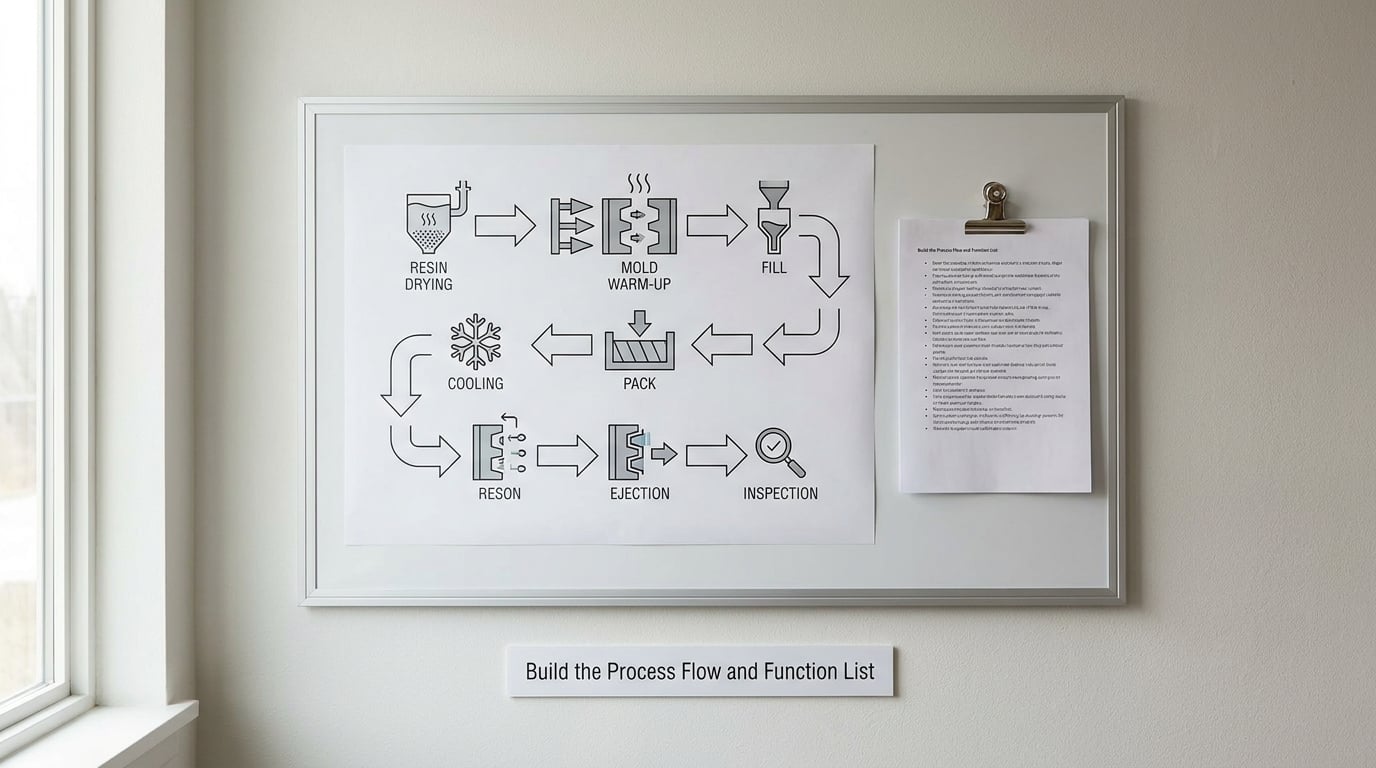
Most injection molding PFMEAs key to eight or nine steps. Adapt the numbers to your cell, but keep this shape:
- Resin receiving, incoming check and drying
- Material preparation, blending, regrind ratio and feed to the machine
- Mold warm-up, purge and first-shot setup
- Fill and injection
- Pack and hold
- Cooling and mold temperature control
- Ejection and part removal
- Trim, cut and secondary handling
- Final inspection, measurement, packing and labeling
For each step write one line of required function. The function is what the step must achieve, stated positively and measurably: dry resin below 0.02 percent moisture, hold cavity pressure at a minimum of 35 MPa, remove the part without ejector marking on the visible face.
A function written as a task name rather than a requirement gives you nothing to test later. “Dry material” is a task. “Deliver pellets to the throat below 0.02 percent moisture” is a function with a detection method attached.
3. Identify Failure Modes and Effects
At each step, ask what the step can produce that is wrong, and write the effect at two levels. The local effect is what the operator or the machine sees. The end effect is what the customer or the downstream process sees. A short shot locally looks like an incomplete fill; downstream it is an open circuit on an assembly that was never populated.
Use the vocabulary your operators already use, because that is the vocabulary the line will understand. Short shot, sink mark, weld line, jetting, flash, burn mark, silver streak, void, flow mark, witness line, ejector pin mark, insert shift. Generic wording like “part out of specification” is what makes a PFMEA unusable on the floor.
Here is the mapping from what you see to the row it belongs in and the parameter that causes it. This is the one-hop lookup that most troubleshooting guides skip.
| Defect | Typical cause | Process parameter at fault | PFMEA step |
|---|---|---|---|
| Short shot | Trapped air, low melt or mold temperature, long flow path, weak hold | Melt temperature, fill pressure, venting, clamp force | Fill and injection |
| Sink marks | Thick section, insufficient packing, hot melt | Hold pressure, hold time, melt temperature, cooling time | Pack and hold |
| Warpage | Uneven cooling, unbalanced packing, ejection stress, material orientation | Mold temperature balance, cooling time, ejection speed | Cooling and ejection |
| Flash | Clamp force too low for cavity pressure, worn or damaged tooling, parting line mismatch | Clamp force, hold pressure, parting line condition | Mold tooling and fill |
| Burn mark | Poor venting, air compressed at the end of fill, high back pressure | Vent depth and position, back pressure, fill speed | Fill and injection |
| Weld line | Multiple flow fronts meeting around a hole or boss | Melt temperature, fill speed, gate location | Fill and injection |
| Silver streak or splay | Moisture in the resin, trapped gas, degraded material | Drying temperature and time, melt temperature | Resin drying |
| Void | Air trapped at a thick section, regrind contamination | Hold pressure profile, back pressure, regrind ratio | Pack and hold |
| Flow or weld-mark streaks | Melt temperature too low, cold slug, poor plastication | Melt temperature, screw speed, back pressure | Material preparation |
| Ejector pin mark | Ejection too early or too fast, pin imbalance, small draft | Ejection speed, cooling time, mold draft | Ejection and part removal |
| Insert shift or damage | Insert not retained, high injection force against the insert, no insert cooling | Fill pressure, packing force, insert temperature control | Fill and injection |
| Color streak | Poor pigment dispersion, low screw speed, excessive regrind | Screw speed, melt temperature, back pressure, regrind ratio | Material preparation |
4. Identify Causes and Prevention Controls
For each failure mode, write every plausible cause you can act on, then attach the control that stops the cause from ever occurring. A prevention control changes the process so the failure never appears. A detection control finds it after it appears, before the part leaves the cell.
Molding has unusually strong prevention controls available, and most teams under-use them because they think in detection terms. Parameter lockouts on the machine, cavity pressure sensors, monitored purge and drying cycles, resin moisture verification per lot, and gated parameter recipes per cavity are all prevention. First-article inspection, in-process dimension sampling, and last-shot checks are detection.
| Control | Type | What it moves |
|---|---|---|
| Machine parameter lockout with changeover password | Prevention | Occurrence |
| Resin moisture check per drying lot | Prevention | Occurrence |
| Monitored drying cycle with logged dew point | Prevention | Occurrence |
| Cavity pressure sensor monitoring | Prevention | Occurrence |
| Periodic parting line and vent inspection in the TPM plan | Prevention | Occurrence |
| First-article inspection at changeover | Detection | Detection |
| In-process dimension sampling, say every two hours | Detection | Detection |
| Last-shot check before the runner is cleaned | Detection | Detection |
| Automated vision or cavity monitoring | Detection | Detection |
Cycle time is the real constraint in most shops, and it deserves an honest mention. Controls that add zero seconds come first: parameter lockouts, cavity pressure sensing, moisture verification, and TPM inspection intervals. Only after those are exhausted should you propose longer cooling time, extra cooling circuits, or 100 percent inspection, and when you do, say what the added seconds cost you in annual capacity.
5. Score Severity, Occurrence, and Detection for Molding Defects
Use the same three definitions every time, because inconsistent wording is the single biggest reason two engineers score the same row differently.
Severity is the worst harm the failure can cause if it reaches the customer, judged from the customer end, not from the convenience of your inspection. Occurrence is how often the cause is likely to appear under your current controls. Detection is how likely your current controls are to catch it before the part leaves the line, judged by the control that exists today, not the one you plan to add.
| Score | Severity anchor for a molded part | Occurrence anchor (evidence required) | Detection anchor |
|---|---|---|---|
| 1 to 2 | No effect on function; a cosmetic mark on a hidden surface | No occurrences in process history; capable process with Cpk at or above 1.33 for the driving characteristic | Certain detection: 100 percent automated or gauged, proven capable |
| 3 to 4 | Visible cosmetic defect on a customer-facing surface; minor dimensional deviation inside tolerance | Very low rate; under 1 defect per million, or scrap well under 0.1 percent with stable capability data | Reliable detection: capable gauge, low sampling, 100 percent attribute check by a trained operator |
| 5 to 6 | Dimensional deviation near the tolerance limit, or a cosmetic defect on a surface the customer inspects | Moderate: scrap between 0.1 and 0.5 percent, or ppm in the hundreds, without stable capability evidence | Moderate: sampling inspection with an attribute gauge of limited capability |
| 7 to 8 | Loss of a function: sealing leak, insert loose, part out of tolerance at the customer | High: scrap 0.5 to 2 percent, or repeated customer complaints on the same defect | Low: visual only, infrequent sampling, or a control with known poor detection |
| 9 to 10 | Safety or regulatory exposure, or a defect that stops the customer line with no containment available | Very high: scrap above 2 percent, or the failure recurs routinely | No effective control, or detection only after the part reaches the customer |
Two hard rules keep the ratings honest. Sampling inspection never earns a Detection score of 3 or better, because a sample cannot reliably catch every part. An Occurrence score of 2 or 3 requires capability data on the record, not a verbal assurance. Those two rules alone stop most over-scoring.
6. Calculate the RPN and Set Action Priorities
The Risk Priority Number is Severity multiplied by Occurrence multiplied by Detection, giving a value from 1 to 1000. Older AIAG guidance treated an RPN above 100 as an automatic action trigger. That is a blunt instrument, and the more useful lesson is that a low RPN can still hide a serious problem: a severity of 9 paired with two low ratings produces a modest number.
AIAG-VDA replaced the RPN rule with the Action Priority table, which reads Severity, Occurrence and Detection together and returns High, Medium or Low. A High Action Priority obliges you to act and to identify a responsible owner, whether the RPN is large or not. Keep RPN in the sheet as a sorting aid if your customers expect it, but let Action Priority drive the work list.
7. Define Detection Measures and Corrective Actions
Every High and Medium row needs an action, an owner, a due date and a verification method. An action that cannot be verified is a wish. Prefer actions that change the process, and set residual Occurrence and Detection values that assume the action is complete, not values that repeat the original numbers.
Here is a worked injection molding PFMEA matrix for an automotive interior clip in glass-filled nylon, four cavities, single shift, with the critical characteristic being the retention clip dimension.
| Step | Failure mode | Effect | Potential cause | Current controls | S | O | D | AP | Recommended action | Residual AP |
|---|---|---|---|---|---|---|---|---|---|---|
| 2. Material preparation | Resin not dry, moisture above 0.02 percent | Silver streaks, splay, reduced strength on the clip | Drying time below specification, hopper lid not closed, dew point not controlled | Prevention: monitored drying cycle with logged dew point. Detection: moisture check per lot | 5 | 4 | 5 | M | Interlock the dryer with the machine so it cannot run outside the cycle; add a weekly hopper seal check to the TPM plan | L |
| 2. Material preparation | Regrind ratio above 30 percent | Variable viscosity, inconsistent color, lower retention strength | Regrind not weighed at the crusher, batch mixing without records | Prevention: locked ratio set at the crusher with a keyed counter | 6 | 5 | 7 | H | Install a batch recipe per shift and record the actual regrind weight on the run sheet | M |
| 3. Mold warm-up and first shot | First-article shot taken before the mold reaches temperature | Sink, flow marks and short shots recorded as the new standard | Cycle start timer set by the operator, no temperature interlock | Detection: visual first-article inspection | 4 | 6 | 6 | H | Block cycle start until zone temperature is inside the process window, enforced in the machine recipe | L |
| 4. Fill and injection | Short shot in one of four cavities | Part not formed, cavity blocked, downstream assembly incomplete | Trapped air, cavity imbalance, melt temperature drift, low fill pressure | Prevention: venting inspection in the TPM plan. Detection: first-article and hourly last-shot check | 8 | 5 | 7 | H | Add cavity pressure monitoring with a per-cavity low-pressure alarm, and rebalance the runner | M |
| 4. Fill and injection | Insert shift on the overmoulded feature | Part fails functional test, customer line stop | Insert retention insufficient, high fill force, insert thermal growth | Prevention: none today. Detection: functional test at final inspection | 9 | 4 | 6 | H | Add insert retention geometry and cycle the first tool through a thermal check; escalate to the tooling engineer | M |
| 5. Pack and hold | Sink mark on the visible face | Cosmetic reject, customer complaint | Hold pressure drift, hold time shortened for cycle time, melt temperature high | Prevention: parameter lockout on the machine. Detection: hourly visual check against the boundary sample | 4 | 6 | 4 | H | Lock hold pressure and hold time in the recipe, and set a cosmetic boundary sample for hourly comparison | L |
| 5. Pack and hold | Void inside a thick boss | Reduced strength, crack under assembly load | Hold pressure profile not staged, back pressure high, regrind contamination | Detection: no routine internal check | 7 | 5 | 9 | H | Stage the hold profile, then qualify with cut sections on the first ten production lots | M |
| 6. Cooling and mold temperature | Warpage beyond the flatness limit | Part fails assembly, misaligned feature | Cooling circuit imbalance across cavities, cooling time cut to raise output | Prevention: none today. Detection: go/no-go flatness gauge every two hours | 7 | 6 | 6 | H | Balance the coolant circuits and log inlet and outlet temperature per cavity for one week | M |
| 7. Ejection and removal | Ejector pin mark on the visible face | Cosmetic reject | Ejection speed set high, cooling time shortened, draft below 1 degree on the pin boss | Prevention: parameter lockout. Detection: hourly visual check | 4 | 5 | 4 | M | Lower ejection speed in the recipe and raise draft at the next tooling modification; no cycle time cost | L |
| 9. Final inspection and packing | Label wrong or missing on the carton | Wrong part delivered to the customer line | Label verification is visual, part number changed at short notice | Detection: single visual check at packing, no scan | 7 | 3 | 8 | H | Scan-to-verify at packing and add a part number change gate requiring quality sign-off before the label is reprinted | L |
Here is the reasoning behind the four rows an auditor will press hardest. This is the part most published examples leave out.
Short shot in one of four cavities. Severity 8 because an unformed clip stops an assembly operation downstream, with no field containment available. Occurrence 5 because the current scrap record shows roughly 0.3 percent on this family of defects, and there is no stable cavity-to-cavity capability data, so a lower score would need evidence that does not exist. Detection 7 because an hourly last-shot check samples roughly one part in several hundred, and cavity balance problems appear intermittently.
Sink mark on the visible face. Severity 4, not 8, because the clip is an interior component and the affected face is not a sealing surface. Rate the same sink mark at 8 or 9 if it lands on a weather seal and the severity changes completely. Occurrence 6 from a cosmetic reject rate between 0.5 and 1 percent on the shift log. Detection 4 because the boundary sample comparison at check frequency is a 100 percent visual on the inspected parts with a defined limit sample, which is stronger than a sampled dimensional check.
Void inside the thick boss. Severity 7, since the part may pass visual inspection and fail under assembly load. Occurrence 5 based on two recorded complaints in twelve months at this volume. Detection 9 because there is no routine internal check at all today, and finding this defect requires a cut section.
Wrong label at packing. Detection 8 because a single visual verification with no scan is exactly the kind of control that cannot earn a good score. Sampling rules apply here too, and the fix is a scan-to-verify system rather than a second visual check.
8. Review and Revise the FMEA After Validation
The first PFMEA is a hypothesis. Revise it after the validation runs, and then on any of these triggers: a new tool, a new cavity count, a resin or supplier change, a machine or software change that alters the parameter window, a customer complaint, a process deviation, an internal audit finding, or a new special characteristic on the drawing.
Set a calendar review as well. Annual is the usual minimum for a stable, high-volume part; quarterly for a new program still in launch, or for a part with a defect history that has not settled.
At each review, close out finished actions, update residual ratings with real post-implementation data, add rows for any new failure mode found, and record what changed and why. Version the document, keep the previous one, and note the change in the header. An FMEA with no visible history looks like a template someone filled in last week.
Common Mistakes
Most weak injection molding FMEAs fail for the same handful of reasons, and all of them are visible in an audit.
| Mistake | Why it fails an audit | Fix |
|---|---|---|
| Generic failure modes like “part out of specification” | No technician can act on it, and no control can be designed against it | Use the defect name the operator uses, on the surface where it appears |
| Arbitrary ratings with no evidence | Every rating is challenged, and the whole document loses credibility | Anchor Occurrence to scrap rate, ppm or Cpk; anchor Detection to the actual control |
| Too many functions, or functions written as tasks | Rows multiply, scores dilute, nothing gets priority | One requirement per step, phrased so it can be tested |
| Only detection controls | Rates the process as more likely to fail than it is, and hides design and prevention opportunities | Add at least one prevention control per high-priority row |
| No owner and no due date | Actions never close, residual ratings never improve | Name a person and a date on every High and Medium action |
| Never updated after launch | Scores stop matching reality, and the audit asks why the file predates the process change | Trigger a review on every change, and version the document |
| Recommendations that add cycle time | Actions get rejected on the floor, so the residual rating is fiction | Propose zero-cycle-time controls first, then price the time you are asking for |
One more habit pays for itself. Keep the step numbering identical across the process flow diagram, the PFMEA and the Control Plan. When those three documents disagree on step numbers, an auditor stops listening to your content and starts looking for a bigger problem.
For context on why this matters day to day, a thread on r/MechanicalEngineering asked how experienced engineers actually troubleshoot molding defects, and the answers described an iterative parameter-change loop built on personal judgment. A PFMEA replaces that tribal loop with something a new engineer can read, challenge and improve. On safety-side analysis such as guarding and lockout, that is a separate document, but the two can share step numbering so the machine-level steps line up.
Frequently Asked Questions
What are the 5 steps of the FMEA process?
The five steps are: prepare the analysis by defining scope, team and data; identify failure modes and their effects; identify causes and the controls already in place; score each row for Severity, Occurrence and Detection and set the Action Priority; then assign, implement and verify actions and re-score to show the residual risk fell.
What are the four types of FMEA?
The four types are the Design FMEA, which analyses the product design, the Process FMEA, which analyses how the part is made, the Interface FMEA, which analyses the boundaries between parts or suppliers, and the Concept or Functional FMEA, which analyses early design intent. A molding cell normally owns the Process FMEA.
What is the difference between a PFMEA and an FMEA?
FMEA is the general name for the method: a preventive analysis of how something can fail. A PFMEA is the specific application that looks at a manufacturing or assembly process. When someone says we are doing an FMEA in a molding plant, they almost always mean the Process FMEA covering the molding cycle.
Is FMEA lean or Six Sigma?
Neither. FMEA is a risk analysis method that came out of the automotive and aerospace quality world, and it sits alongside both Lean and Six Sigma rather than inside either one. In practice it works well beside them: Lean removes waste in the process, Six Sigma reduces variation, and the PFMEA tells you which variation actually costs you the most.
How often should an injection molding PFMEA be reviewed?
Review it after validation runs, and then on any trigger: a new tool or cavity count, a resin or supplier change, a parameter window change, a customer complaint, a process deviation or an audit finding. Put a calendar reminder on top of that, annually for a stable part and quarterly while a new program is still in launch.
What is the difference between an FMEA and a control plan?
The FMEA is the analysis. It predicts how the process can fail, rates the risk, and justifies the actions you decided to take. The control plan is the resulting instruction: for each characteristic, who measures it, with what method, at what frequency and sample size, and what the reaction plan is when it fails.
Conclusion: Where to Start
Start with your worst repeat defect and build a single-page PFMEA for it: the step, the failure mode, the effect on the customer, the cause, the parameter that controls it, the S/O/D scores with the evidence behind each, and one action that does not cost you cycle time. That page, done properly, is worth more than a forty-row worksheet nobody updates.
Then run the full build in a single workshop with the people who run the machine in the room, keep the step numbering aligned with your Control Plan, and set the review triggers before the meeting ends. Revisit this guide when the process changes, and the document keeps pace with the process instead of the audit cycle.