

ABC inventory analysis is a classification method that ranks every SKU by its share of total inventory value and sorts the catalog into three groups, A, B and C, so management effort follows financial impact instead of item count. The classic starting split puts roughly 80% of value in A items, 15% in B items and 5% in C items.
That is the whole idea. Most catalogs are lopsided: a few hundred SKUs carry most of the money, and thousands of the rest barely register. Treating both groups with the same reorder rule, the same count frequency and the same planner time is how good operations quietly lose margin.
The rest of this guide covers how the ranking is built, how to run it in a spreadsheet this month, and what to change in the warehouse once you know which items are in which class.
Table of Contents
- What Is ABC Inventory Analysis?
- How ABC Inventory Analysis Works
- How to Classify Inventory Using the 80/20 Method
- What Data Do You Need for ABC Inventory Analysis?
- How to Calculate ABC Inventory Analysis
- How to Set ABC Cutoffs for Your Business
- How to Turn ABC Classes into Inventory Actions
- ABC Analysis for Plastic Materials and Packaging Supplies
- Common ABC Inventory Analysis Mistakes
- Frequently Asked Questions
- Conclusion: What to Do First
What Is ABC Inventory Analysis?
ABC inventory analysis is a way of answering one question: where is our working capital actually sitting, and which items deserve tight control because of that?
The ranking metric is annual consumption value, which is the annual quantity used multiplied by the unit cost of the item. It is deliberately not the unit price and not the physical count. A cheap bag of screws consumed by the thousand can outrank a costly component you replace twice a year.
The output is a label attached to each SKU. That label then drives cycle count frequency, review cadence, safety stock policy, service level targets, slotting location and how closely a buyer watches the supplier. Without a classification, everyone gets the same treatment, and the treatment is usually wrong for both ends of the catalog at once.
How ABC Inventory Analysis Works
The method is three steps, and the middle one is where people go wrong.
- Calculate the annual consumption value for every SKU in the group.
- Sort the list from highest value to lowest and compute a running total as a percentage of the group value.
- Classify by cutting that cumulative curve at your chosen thresholds.
Items above the first cut are A, items between the two cuts are B, and everything below the second cut is C. The curve almost always has the same shape: a steep drop followed by a long flat tail. That shape is the Pareto pattern, and it is the reason a small share of SKUs deserves most of the oversight.
A worked set of numbers makes it concrete. Take five items in a small fabrication shop, with a group value of 52,920:
| SKU | Unit cost | Annual qty | Consumption value | Cumulative % | Class |
|---|---|---|---|---|---|
| Steel bracket | 18.40 | 1,200 | 22,080 | 42% | A |
| Aluminium extrusion | 9.75 | 1,600 | 15,600 | 71% | A |
| Silicone gasket | 0.85 | 9,000 | 7,650 | 86% | B |
| Carton, large | 1.20 | 4,000 | 4,800 | 95% | B |
| Label roll | 3.10 | 900 | 2,790 | 100% | C |
Two items out of five carry 71% of the value, so both are A. Now look at the gasket: at 0.85 a unit it is the cheapest line in the set, yet it consumes nearly three times the value of the 3.10 label roll and lands in B on value alone. A unit-price sort would have filed it last, which is exactly the mistake the method exists to prevent.
How to Classify Inventory Using the 80/20 Method
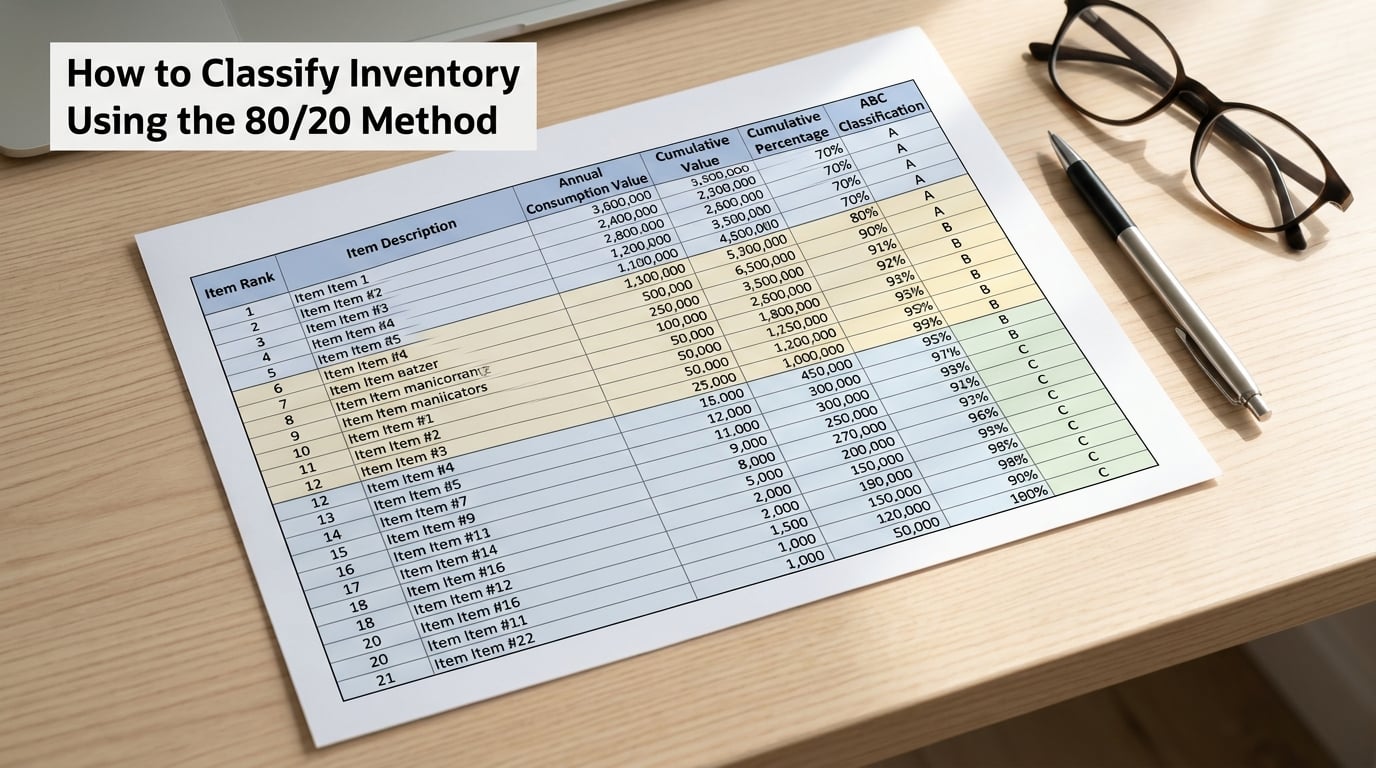
The 80/15/5 split is a starting point, not a law. It comes from the Pareto principle, the observation that a minority of inputs usually accounts for a majority of output.
Here is what each class typically looks like across a broad catalog:
| Class | Share of value | Share of SKUs | Control approach |
|---|---|---|---|
| A | About 80% | About 15-20% | Strict control, frequent counts, tight service targets |
| B | About 15% | About 25-30% | Moderate oversight, standard rules |
| C | About 5% | About 50% | Simple controls, minimal buffers, easy to order |
Notice the last row. Half your SKUs sitting in 5% of value is the normal outcome, and it is the row most teams neglect, then wonder why their planners are exhausted.
Where the 80/20 rule comes from in ABC analysis
The rule is named after Vilfredo Pareto, an Italian engineer who observed in the early 1900s that roughly 80% of Italian land was owned by 20% of the population. In inventory the pattern shows up because demand and cost multiply: a modest quantity of an expensive item can out-consume a pile of a cheap one.
Treat 80/20 as a prior, not a measurement. Run the cumulative curve on your own data and see where it actually flattens.
What Data Do You Need for ABC Inventory Analysis?
You need SKU-level data, and you need it per planning group rather than across the entire catalog. Ranking resin alongside finished cartons alongside spare tooling produces a curve dominated by whichever group is largest, and the resulting classes are useless in every group at once.
The required fields per SKU:
- Item number or SKU and a short description.
- Annual usage quantity, taken from actual issues or shipments over a full year.
- Unit cost, the standard or moving average cost you actually pay.
- Annual consumption value, which you calculate from the two fields above.
- Supplier and lead time, in days, including any receiving delay you have measured rather than assumed.
- Demand variability and any recorded shortage history, both of which decide buffer sizing later.
Two cautions on the data. Twelve months of history beats three because it captures seasonality; if a product launched halfway through the year, annualise it or run the analysis twice, once before and once after a full cycle. And use the cost you pay, not the list price on a quote.
How to Calculate ABC Inventory Analysis
Here is the spreadsheet procedure, in order.
The ABC inventory analysis formula, step by step
- Export one row per SKU with usage quantity and unit cost from your ERP or inventory system.
- Calculate consumption value in a new column:
=Qty * UnitCost. - Sort descending on that column.
- Add a running total with
=SUM($D$2:D2), then convert it to a share of the group with=E2/SUM($D$2:$D$200)formatted as a percentage. - Read off the cumulative percentage at each row and decide your cuts.
- Assign the class label, then paste it back into the ERP as a field your planning rules can read.
That last step is where a lot of analyses quietly die. A classification sitting in a spreadsheet has no effect on replenishment. Tag the SKU in the master data, or the WMS will keep applying the same rule to everything.
If your catalog runs past a few thousand active SKUs, the manual sort stops being fun. That is the point to move the calculation into the system and keep the spreadsheet for reviewing the cut decisions, not for producing the ranking.
How to Set ABC Cutoffs for Your Business
Standard 80/15/5 is useful when your catalog is broad and your control systems are mature. Move the cut when your value is concentrated differently, and move it in the opposite direction when the class sizes come out unusable.
Two failure modes to watch. If A ends up with 60% of your SKUs, the threshold is too loose to change anyone’s behaviour, so the analysis teaches nothing. If A ends up with 12 SKUs, you have not really controlled anything; you have made a shortlist.
A useful test: after classifying, can you name a specific different action for each class that somebody will actually do differently this quarter? If not, move the cut until you can.
Then overlay a criticality flag. In manufacturing, a low-value part that stops a line when it runs out belongs in A treatment regardless of where its consumption value falls. Value says how much money is involved, criticality says how much time is involved, and for production continuity the second often wins.
How to Turn ABC Classes into Inventory Actions
A classification that changes nothing on the floor is a filing exercise. These are the actions worth differentiating.
| Action | A items | B items | C items |
|---|---|---|---|
| Cycle count frequency | Monthly or better | Quarterly | Once or twice a year |
| Review cycle | Weekly planner review | Monthly | Quarterly or on reorder |
| Service level target | High, near 98% | Around 95% | Lower, order-point driven |
| Safety stock | Calculated from lead time and variability | Simplified rule | Minimal or none |
| Ordering approach | Planned, forecast-driven, closer supplier relationships | Order point with review | Made to order, bulk when needed |
| Slotting | Close to pick and dispatch | Standard locations | Bulk storage, low-traffic zones |
On cycle counting specifically, the two ideas are complementary rather than competing. ABC analysis tells you what to count first; cycle counting is the schedule that gets it counted. Pairing them is how the classification turns into record accuracy.
ABC Analysis for Plastic Materials and Packaging Supplies
Plastics and packaging complicate the method in a few specific ways.
Resin and masterbatch are high value, low line-item count and frequently bought in large minimum order quantities, so a small catalogue can hold most of your spend. Additives split the other way: dozens of SKUs, small values, but each one is a formulation requirement you cannot substitute on the spot.
Moulds and tooling are the awkward case. A single mould can represent more capital than a year of resin, but it is not consumed and it does not belong in a consumption-value ranking at all. Track those separately as assets with maintenance and calibration intervals.
Kitted materials need care. If you ship a kit, classify the kit’s total value, not the components, or every kit lands in A and the analysis stops discriminating.
The lesson for this category is that low unit cost and low importance are different things. A 0.30 seal in a food-grade assembly is cheap and completely unskippable.
Common ABC Inventory Analysis Mistakes
Ranking by unit price instead of usage value. This is the most common error and it inverts your catalog. The cheap high-volume item is the one that matters, and a price sort buries it.
Using one month of demand. Seasonality then decides your classes, and half of them are wrong by February. Use a full year.
Ignoring lead time. Value tells you where the money is, but the buffer decision belongs to the item with the long or erratic supplier lead time, which is often not the item with the highest value.
Never re-running it. Classes drift as prices, designs and volumes change. A quarterly or annual refresh is the minimum for a moving catalog, and monthly is reasonable for a fast-moving one.
Treating C items as unimportant. C means low value, not low consequence. C items are the ones that are easiest to rationalise, and the bulk of them should probably be deleted rather than controlled.
Classifying the whole catalog in one pass. A single curve across unrelated planning groups produces three classes that mean nothing in any of them. Segment first.
Frequently Asked Questions
What is ABC inventory analysis?
ABC inventory analysis ranks every SKU by its annual consumption value, which is annual usage quantity multiplied by unit cost, then splits the ranked list into three classes: A, B and C. The point is to match control effort to financial impact, so a small number of high-value items get tight oversight while the long tail runs on simple rules. It is a classification label, not a system or a code.
What does ABC stand for in inventory management?
ABC is not an acronym. The letters A, B and C are simply labels for three value tiers: the items carrying roughly the first 80% of consumption value, the next 15%, and the final 5%. Nothing in the letters expands into a phrase, and no standards body assigns meanings to them. The labels are conventions your team agrees on and applies consistently.
What is the 80/20 rule in ABC analysis?
The 80/20 rule says that about 80% of total inventory value tends to sit in roughly 20% of the SKUs. It comes from the Pareto principle and it explains why ABC classification works: a small group of items deserves most of the planning attention. In practice the split is often 80/15/5 across A, B and C, but treat it as a starting point and check where your own cumulative curve flattens.
What is the ABC code for inventory?
There is no universal ABC code. The A, B or C letter is an internal classification tag that your team applies to a SKU so control rules can react to it. It is unrelated to barcodes, GL account codes or any standard. If you need the label to drive replenishment, store it as a field in your item master and make sure your planning rules actually read it.
What is the difference between ABC analysis and EOQ?
EOQ, economic order quantity, calculates the optimal order size for one item by balancing ordering cost against holding cost. ABC analysis does not calculate an order size at all; it ranks items by value so you know which ones deserve the most attention. They are complementary: ABC tells you where to focus, EOQ tells you how much to order on the items that pass the A and B cutoffs.
How often should I re-run ABC analysis?
Most teams get value from a quarterly refresh, and fast-moving or seasonal catalogs benefit from a monthly one. Run it again whenever a supplier change moves costs, a new product launches, or a design change retires a high-volume item. Signs your classes have gone stale: stockouts on items you classified as C, and planners still spending equal time on items you know barely move.
Conclusion: What to Do First
Start with the export. Pull twelve months of SKU-level usage and standard cost for one planning group, calculate annual consumption value for each line, and sort descending.
Add the running total column, read off where the cumulative percentage passes 80% and 95%, and assign the classes. Then check that the A list is short enough to review weekly and that you can name a genuinely different action for each class.
Finally, flag anything that would stop a line, and write the class back into the item master. ABC inventory analysis only pays for itself once the label changes what your team does on Monday morning. Last reviewed for 2026.