

A lifecycle assessment on a plastic product is a structured, ISO 14040-standardised method for quantifying the environmental impacts of that product across every stage of its life: raw material extraction, compounding, moulding, transport, use and end of life. You define the goal and functional unit, build an inventory of material and energy flows, translate that inventory into impact categories such as global warming potential, then interpret which stages dominate.
For plastics this is the only reliable way to know whether a change actually helps. Switching to recycled content, dropping 10 grams of wall thickness or moving production closer to the customer can each look like a win and end up shifting burden to a different stage. Run the study before you commit the tooling budget.
On time and effort: a screening study built from generic database data takes a few days. A cradle-to-grave study using plant data typically runs six to twelve weeks. It is a data-gathering exercise more than a modelling one, and the hardest part is almost always getting consistent numbers out of suppliers, not operating the software.
Table of Contents
- What You Need Before You Start
- Step-by-Step: How to Run a Lifecycle Assessment on a Plastic Product
- 1. Define the Goal, Audience, and Scope
- 2. Map the Full Plastic Product Lifecycle
- 3. Build the Bill of Materials and Process Inventory
- 4. Gather Reliable Environmental Data
- 5. Calculate Impacts by Lifecycle Stage
- 6. Check Quality, Sensitivities, and Uncertainty
- 7. Report Results and Identify Improvement Priorities
- Common Mistakes
- Frequently Asked Questions
- How long does a lifecycle assessment take, and how much does one cost?
- What is a functional unit, and how do I choose one for plastic packaging?
- Is recycled plastic always better for the environment?
- What is the difference between an LCA and a product carbon footprint?
- Do I need an ISO 14040 compliant study, or is a screening model enough?
- Should we run the assessment ourselves or hire a consultant?
- Conclusion
What You Need Before You Start
A credible assessment needs five things lined up before anyone opens a tool. Missing any one of them usually produces a study that looks rigorous and cannot survive a customer’s technical review.
- A defined function for the product. What does the product do, how well, and for how long? For packaging that means the fill volume, the barrier performance, the shelf life in days and the food-contact compliance it must hold. Without a written function statement you cannot write a defensible functional unit.
- An engineering bill of materials. Every material with its mass in grams: polymer by grade, masterbatch and additive loadings, colourants, labels, closures, liners, and any non-plastic components such as metal or elastomeric seals.
- Process data. Cycle times and machine energy for injection moulding, extrusion, thermoforming or blow moulding, plus scrap rates, regrind loops, reject rates, and packaging and pallet configuration.
- Environmental data. Either primary supplier data (specific electricity use, actual resin production figures) or a licensed generic database you can honestly label as industry-average data.
- Software and the standards. Any LCA-capable tool, plus ISO 14040 and ISO 14044 for the study structure. If you intend to make a public environmental claim, add ISO 14021, which governs self-declared claims and is a separate legal question from running a study.
- People. Typically one process or manufacturing engineer, one buyer or supply-chain contact, and one person who owns the sustainability or compliance requirement. Consultants can take the modelling on; nobody else can give you your own process data.
If you have zero internal data, do not stop. Start with generic data for screening, use the contribution analysis to see which inputs matter, then spend your collection effort only on those. Practitioners describe this as the sensible order of operations, and it is much cheaper than a full data request to every supplier on day one.
Step-by-Step: How to Run a Lifecycle Assessment on a Plastic Product
1. Define the Goal, Audience, and Scope
The goal and scope definition is the single document that decides whether the rest of the study is worth anything. Write it first, before collecting data, and get it signed off by the person who will make the decision.
Start with the decision. Comparing two container designs? Reducing Scope 3 emissions for an OEM customer? Qualifying for eco-modulated fees under an extended producer responsibility scheme? Each decision needs different precision and a different audience, and a study built for one of these rarely serves the others.
Next, fix the functional unit. It is the reference against which everything else is counted, and it is the most skipped and most consequential choice in a plastic LCA. For a beverage container, “one 500 ml bottle that protects 500 ml of product for 120 days” is a real functional unit. “One bottle” is not, because it says nothing about whether the bottle does its job. For durable goods, divide by service life instead: an impact per 1,000 wash cycles, or per year in service, or per kilometre driven.
Set the system boundary next. A cradle-to-gate study covers resin production through the part leaving your factory gate, which is usually enough for design decisions and for OEM supplier requests. A cradle-to-grave study adds transport, use, reuse and end of life, which is heavier but often the only honest way to compare a heavy reusable pack against a light single-use one.
Decide allocation rules before you see any numbers, not after. For recycled resin there are two common approaches and they point in opposite directions. Under a cut-off approach, recycled material enters the system with the burdens of collecting and reprocessing it but no credit for the virgin plastic it displaces, so recycled input looks clearly better. Under an avoided-burden approach, the system gets a credit for the virgin production that recycled material substitutes. State which you used and why, and run the other as a sensitivity case if the conclusion depends on it.
Finish with data quality requirements and cut-off criteria. Set the required precision, identify which parameters must be primary data, and decide what fraction of mass you will ignore by name rather than by silence. Also record reference flow: the quantity of finished product that represents one functional unit, after accounting for yield.
2. Map the Full Plastic Product Lifecycle
A plastic product’s life cycle splits into eight stages you need to account for explicitly. Miss one, and your inventory silently omits it.
- Feedstock and resin production: cracking or polymerisation of naphtha or ethane, energy, and the associated process emissions.
- Additives and compounding: stabilisers, pigments, flame retardants, masterbatch production and the energy of the compounding line.
- Conversion: injection moulding, extrusion, thermoforming or blow moulding, plus the manufacture and amortisation of the mould and tooling itself.
- Assembly and packaging: closures, labels, secondary packaging, stretch film, pallets and dunnage.
- Transport: inbound resin freight and outbound finished-goods distribution to the customer.
- Use: for packaging, essentially the protection function; for durable plastic parts, cleaning, washing cycles, replacement and any service life.
- Reuse and refilling: number of reuse cycles, wash energy and water, and reverse logistics.
- End of life: collection, sorting, recycling, energy recovery or disposal.
Stage eight is where plastic studies turn into opinion, because the end-of-life scenario usually dominates the answer and none of the scenarios is a fact about the world. It is an assumption. Model at least three and report the spread.
| End-of-life scenario | Key modelling assumptions | Typical direction of the result |
|---|---|---|
| Mechanical recycling | Collection rate, sorting yield, contamination, number of cycles before downcycling, share of recycled output actually sold | Favours mono-material, easy-to-sort designs; a credit only where a real market absorbs the output |
| Chemical recycling | Yield of recovered polymer, energy carrier and heat source, whether output re-enters the same resin stream | High energy demand; result flips on the energy carrier, so document it |
| Energy recovery (incineration with heat or power use) | Grid displacement factor, incineration efficiency, avoided landfill and avoided virgin production | Depends almost entirely on the displaced energy source and on recycling being excluded or capped by priority |
| Landfill | Share of material that never gets collected, degradation over time, avoided tipping credit | Usually the highest burden per functional unit, and the honest baseline for waste that is not collected |
On the claim that 91% of plastic is never recycled: treat it as a contested framing, not a planning input. Global figures of that kind combine different polymer families, regions and measurement years, and practitioners regularly dispute what should count as recycled. For your assessment, use the collection and recycling rates that apply to your product in the market you actually sell into.
3. Build the Bill of Materials and Process Inventory
The inventory is a quantified list of every material and energy flow in the system, per functional unit. This is the most concrete part of the work and it lives or dies on the engineering bill of materials.
Work in kilograms of finished product and convert up to grams for small components. For each line record the polymer, grade, mass, recycled content percentage, supplier, origin country, and any additive loadings. Then add the conversion processes: which machine, how much electricity per kilogram, what scrap rate, and what share of that scrap is reground back into the product versus downgraded or discarded. Regrind loops are where studies go wrong, because an extra trip through the line is usually not in anyone’s data.
Add packaging and distribution next: primary, secondary and tertiary packaging per shipped unit, pallet configuration, and inbound and outbound distances with the mode of transport. Then state the product lifetime, because for durable plastic parts a longer service life spreads the same manufacturing impact over more years of service, and for disposable packaging the reference flow and the fill rate do the same job.
Sanity-check with a mass balance before you go further. The total mass of inputs should equal finished mass plus scrap plus process losses, and it should reconcile with the grams-per-unit figure the packaging team uses on the line. If it does not, fix it now rather than debugging a result later.
4. Gather Reliable Environmental Data
Data quality is where plastic studies are won or lost. There are two kinds and you should label which is which throughout the report.
Primary data is specific to your supply chain: the actual energy consumption of your moulding cell, the actual production figures from your resin supplier, measured scrap. Secondary data is generic industry-average information from a commercial or open database such as ecoinvent or an EU-derived ILCD dataset, or regional electricity grid factors. Generic data is not a weakness, but presenting it as if it were your own supply chain is. Label every dataset in your inventory.
Where to look for each stage:
- Resin production, compounding and additives: generic plastics and petrochemical datasets in your chosen database, plus supplier-specific EPDs or PCFs when the resin matters to the conclusion.
- Conversion energy: your own metering data. Where metering does not exist, use machine nameplate data with a stated derating assumption and flag it as low quality.
- Electricity: the grid factor for the region and year of the plant. This is a common error, because a moulding cell in one grid and another in a different grid do not have the same footprint.
- Transport: freight mode, distance and load factor. Distance alone, with no load factor, overstates or understates by a wide margin.
- End of life: collection, sorting and recycling datasets from the same database family, so the scenarios stay internally consistent.
For supplier data requests, send one questionnaire with a fixed unit basis and a deadline, not a series of emails. Ask for: mass of material supplied per period, energy consumption with the measurement method stated, primary process emissions, transport mode and distance, packaging configuration, and recycled or bio-based content with certification. Specify the unit and period in the request itself, because “per month, kilograms” is what stops a supplier sending you annual tonnage.
If a supplier will not respond, document that and substitute a generic dataset with a stated year. Non-response is a data-quality fact you can report; silence is not.
5. Calculate Impacts by Lifecycle Stage
With an inventory and a dataset, the tool links background processes to each foreground flow and characterises the result into impact categories. You run the calculation; the software does the arithmetic. Knowing which tool suits you is worth ten minutes of thought, because the learning curve is the real cost.
| Tool | Licence model | Learning curve | Best for |
|---|---|---|---|
| SimaPro | Subscription with academic options | Moderate to steep | Practitioners who need full control of impact methods and parameters |
| LCA for Experts (formerly GaBi) | Commercial licence with database subscription | Moderate | Engineering-led teams and corporate reporting, strong plastics and chemical coverage |
| Umberto | Commercial licence | Moderate | Companies that want scenario modelling and visual contribution analysis |
| openLCA | Free and open source | Steep, since it is closer to a database engine | Small teams, teaching, and anyone who needs full transparency over datasets |
| EIME | Free tool, database licensing applies | Low | Fast screening of manufacturing processes, common in academic and design studies |
| EuCIA Eco Impact Calculator | Free for industry users | Low | Quick screening of packaging and conversion concepts before a full study |
| Sector-specific PCR tools | Varies | Low to moderate | Packaging and construction work where a product category rule already fixes the method |
On impact categories, resist reporting a single carbon number. Plastic decisions move burdens around, so the categories that matter are the ones that can catch burden shifting.
| Impact category | What it measures | Why it matters for plastic decisions |
|---|---|---|
| Global warming potential (GWP) | Greenhouse gases expressed in CO2 equivalent | Always required; also the headline customers and Scope 3 requests ask for |
| Fossil resource use | Energy from fossil and nuclear primary resources | Catches the case where a lower-carbon material depends on more non-fossil input |
| Water consumption and scarcity | Withdrawal, weighted by local scarcity | Polymerisation and compounding are water-relevant steps in several regions |
| Resource depletion (mineral and metal) | Use of limited raw materials | Additives, pigments and catalysts, not just the polymer |
| Acidification potential | Acid deposition from SOx and NOx emissions | Picks up electricity mix and transport effects that GWP can obscure |
| Eutrophication potential | Nutrient enrichment of water and air | Relevant where production sits near sensitive watersheds |
| Fine particulate matter | Health-related particulate emissions | Regulatory air-quality concerns around polymerisation and incineration |
If you work to a Product Environmental Footprint method, use the indicator set it specifies, since the weighting and normalisation are what make the method recognisable. Report results per functional unit and per stage, then read them as a profile rather than a score.
6. Check Quality, Sensitivities, and Uncertainty
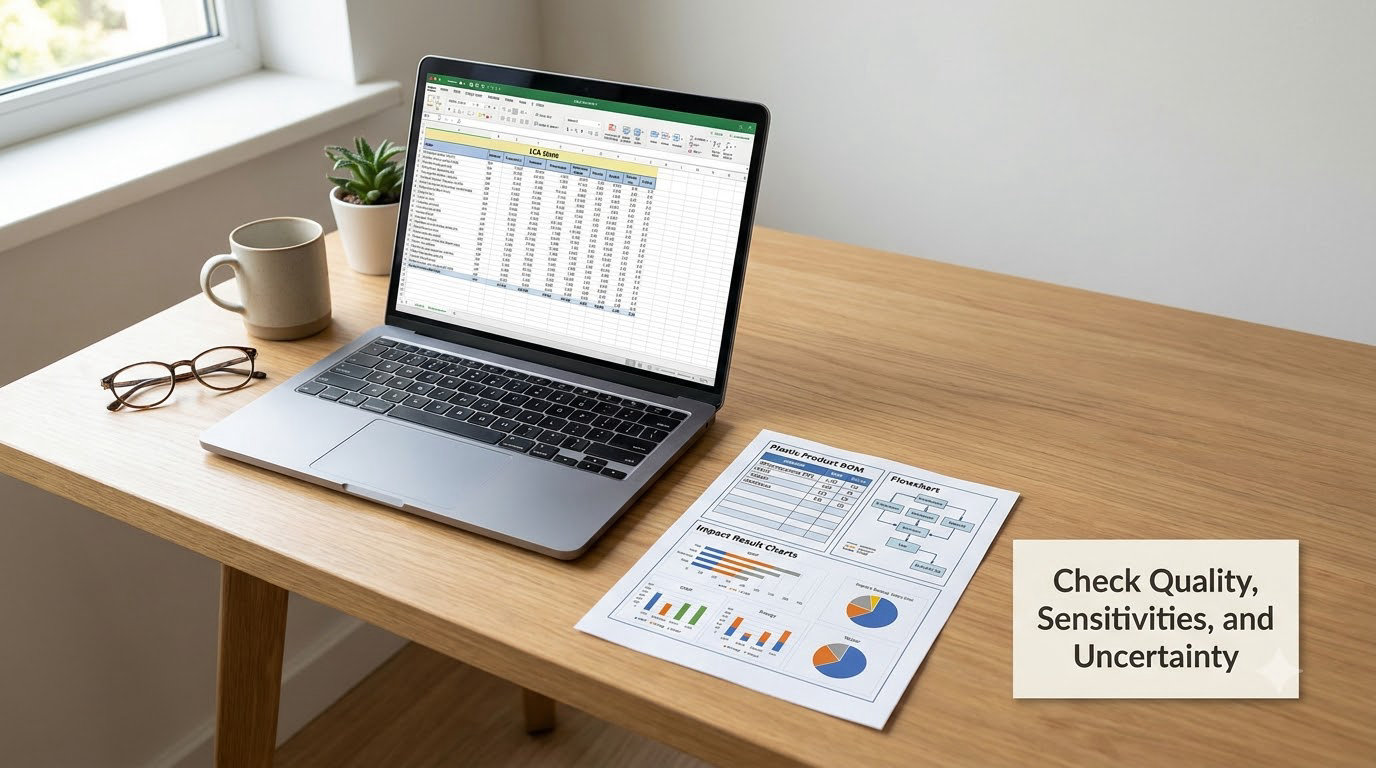
The review step is what separates a study you can act on from a number you cannot defend. Run four checks before you write anything.
First, completeness and consistency. Confirm every stage in your scope diagram has inventory data, every dataset carries a year, geography and source, and units are consistent across the model. Mass and energy balances should close. Any parameter that repeats suspiciously across rows usually means one number got copied too far.
Second, contribution analysis, which is the most useful output you will produce. Rank your stages and your material inputs by share of total impact. For most plastic products, resin production dominates and conversion energy is a minor slice, which is exactly the finding that stops teams from spending money on process optimisation that barely moves the total. Transport is frequently assumed to be the biggest driver, and for many products it is not.
Third, sensitivity analysis. Change one assumption at a time: recycled content, service life, grid factor, collection rate, transport mode, allocation approach. Rank the results by how much the answer moves. Any parameter that can flip your conclusion belongs in the main report, not a footnote.
Fourth, uncertainty. Report a range rather than a single figure for at least the climate category, using scenario or Monte Carlo analysis, and state the data quality of each input. If a supplier figure was estimated rather than measured, say so. Two studies of the same product disagreeing is normal and often explained by assumptions, not by error, so disclose yours.
7. Report Results and Identify Improvement Priorities
A report should let a non-specialist reader follow the logic and a specialist reader check it. Structure it in this order: goal and intended use; functional unit; system boundary, including a diagram; allocation and cut-off choices; data sources with primary and secondary clearly separated; results per functional unit by stage and category; contribution analysis; sensitivity and uncertainty; limitations; and improvement priorities with estimated impact.
On improvement priorities, rank levers by expected impact and implementation difficulty. Mass reduction usually dominates because it cuts resin, conversion energy, transport and end-of-life burden at once. Design for mechanical recycling (mono-material, avoid incompatible barriers and labels, use detachable closures) usually outranks adding post-consumer content to a hard-to-sort design. Increasing service life or reuse works where the use phase is light. Localising production matters for heavy, low-value parts and rarely for lightweight ones.
Be careful how you write conclusions. ISO 14040 results are comparative assertions intended for internal decision support, not public product claims. Public claims fall under ISO 14021 and, in most markets, need substantiation. State the functional unit, boundary, dataset and year in every figure you quote externally, and avoid ranking your product against a named competitor unless the study was designed as a comparative assertion with equal data quality on both sides.
If a customer asks for a verified number rather than a study, an Environmental Product Declaration built on the relevant Product Category Rules is often the better instrument. PCR-based EPDs are verified by third parties, so they carry more weight with procurement teams than a supplier self-report.
Common Mistakes
These are the errors that most often undermine a plastic LCA, each with the fix that resolves it.
- Functional unit that only describes a quantity. Fix: write the function first (volume protected, shelf life, cycles delivered), then express results per unit of that function.
- Cradle-to-gate results presented as a full footprint. Fix: label every figure with its boundary. Gate-to-gate and cradle-to-gate numbers understate real impact and get challenged immediately.
- Generic data described as primary data. Fix: keep a dataset register naming source, year, geography and whether the figure is specific or industry-average.
- Ignoring tooling, rejects and regrind. Fix: model mould manufacture amortised over volume, plus scrap and the regrind loop, even if the numbers are rough.
- One end-of-life scenario treated as fact. Fix: run mechanical recycling, energy recovery and landfill, and report the spread.
- Credit for recycling that no market absorbs. Fix: cap recycling credits by realistic collection and market absorption, and document the cap.
- Allocation switched after seeing the result. Fix: fix cut-off versus avoided-burden in the goal and scope, then run the alternative only as a sensitivity case.
- A single headline carbon number. Fix: report a profile across categories and stages, and state where burden shifted.
- No uncertainty statement. Fix: publish ranges for the headline category and rank parameter sensitivity.
- Overclaiming in the summary. Fix: carry the functional unit, boundary and dataset version into every externally quoted number.
A few practical habits help: keep a versioned assumptions sheet next to the model, because the spreadsheet changes and the notes do not; run the screening model before requesting data so collection effort is targeted; involve the people who run the line, since they spot impossible parameters quickly; and document negative results, because a switch that did not help is a real finding.
Frequently Asked Questions
How long does a lifecycle assessment take, and how much does one cost?
A screening study using generic database data takes a few days to two weeks once the bill of materials exists. A cradle-to-grave study with plant data typically runs six to twelve weeks, and longer if supplier responses are slow. Screening tools are free, commercial platforms need a licence plus database subscription, and a consultant-led study is priced by scope and review depth. Most of the elapsed time is data collection, not modelling.
What is a functional unit, and how do I choose one for plastic packaging?
A functional unit is the reference quantity that all impacts are calculated against, expressed as the amount of delivered function rather than the product itself. For packaging, define it as the volume of product protected, the required barrier and shelf life delivered. For durable parts, use service life instead, such as impacts per 1,000 cycles or per year in service. Choosing it before data collection prevents circular comparisons.
Is recycled plastic always better for the environment?
Often, but not automatically, and the answer depends on the accounting method you choose. Under a cut-off approach recycled input carries only collection and reprocessing burdens, so it looks clearly better. Under avoided burden it also receives a credit for displaced virgin production, which strengthens the case further. Contamination, sorting yield, the number of cycles before downcycling and whether an offtaker exists for the output all erode the benefit, so model them explicitly.
What is the difference between an LCA and a product carbon footprint?
An LCA follows the ISO 14040 and 14044 framework and quantifies multiple impact categories across a defined system. A product carbon footprint is usually a narrower, single-category calculation, often greenhouse gases only, that may follow a different method. Footprints are faster to produce and easier to compare for a Scope 3 disclosure, but they cannot show burden shifting between stages. Use a footprint for reporting and an LCA for design decisions.
Do I need an ISO 14040 compliant study, or is a screening model enough?
A screening model is enough for early design exploration, when materials and processes are still moving, because it uses generic data and moves quickly. Once the design is frozen and you need a defensible number for a customer, a procurement requirement or a public claim, you want a study following ISO 14040 and 14044 with documented scope, data quality and uncertainty. Public environmental claims additionally fall under ISO 14021.
Should we run the assessment ourselves or hire a consultant?
Run it yourself if you have a manufacturing engineer who can supply process data, access to an LCA tool and someone accountable for the decision. Hire a consultant when the study needs external verification, comparative assertions between competing products, PCR or EPD preparation, or when nobody internally owns data collection. A common split is internal screening first, consultant verification on the final design, which keeps the expensive work focused.
Conclusion
Start with the decision, not the software. Write down what you need to choose, define the functional unit that represents the delivered function, fix the system boundary and allocation approach, and only then collect data.
Use the contribution analysis to find the two or three stages that carry most of the impact, spend your remaining effort making those numbers as accurate as you can, and report a profile with uncertainty rather than one headline figure. That sequence is what turns a lifecycle assessment on a plastic product into a design tool instead of a reporting exercise.