

Capacity planning basics for small manufacturers come down to one comparison: what your shop can realistically produce in a given period, versus what the order book says it needs to produce. Run that comparison at the work center that limits output, keep it in a spreadsheet, and repeat it every week. That is the whole discipline, and a shop with three machines and twelve people can do it properly without buying anything.
This guide walks through the inputs you need, the arithmetic for usable capacity, and the weekly review that turns a plan into decisions. It also covers what to do when demand exceeds what your machines can absorb — resequencing, setup reduction, selective overtime, outside processing, or a capital purchase.
A note on the term itself, since the search results for it are crowded. Contact-center capacity planning deals with call volume, average handle time, and shrinkage. Software-team planning deals with velocity and story points. Neither transfers to a factory, where the constraint is a machine, a mold, or a set of hands. Everything below is about physical production capacity.
Table of Contents
What You Need

You need seven inputs before the arithmetic means anything. Most shops already have all of them somewhere; the work is putting them on one page.
- A demand forecast for the next 6 to 12 months, built from actual orders and backlog rather than a sales opinion.
- The current production schedule, including work already committed and where it sits in the process.
- Equipment availability: which machines exist, their shift pattern, and the hours each one is actually scheduled to run.
- Labor availability: operators by skill, cross-training coverage, and scheduled shift hours including any planned overtime.
- Material lead times, including resin, components, and anything subject to compliance documentation such as USP Class VI certification requirements that add review weeks before a material can be used.
- Standard production times for each part: run time per piece and setup or changeover time per job.
- Known shutdowns and maintenance windows, so planned downtime is subtracted before anything is promised to a customer.
A spreadsheet is enough for a first plan. One tab per work center, one tab for demand, one tab that compares them — that structure holds up until you are juggling enough part numbers that manual updates start eating a full day each week.
Optional tools exist at every price point. If you already run an ERP, its capacity view may save you a rebuild, though many small shops use it only for purchasing. A shared calendar is the cheapest way to keep maintenance and shutdown windows honest. Beyond that, basic capacity-planning software starts to make sense when you run many part families across shared equipment and need finite loading you cannot build by hand.
Capacity Planning Basics for Small Manufacturers: Step-by-Step
The workflow has seven steps. The goal throughout is simple: compare available production capacity with expected demand by product, by process, and by time period, then act on the difference before it becomes a late order.
Set the Planning Horizon and Planning Unit
Start by choosing how far ahead you are looking. For a small shop, weekly buckets for the next 6 to 12 weeks cover purchasing, overtime, and promise dates. Monthly buckets work for hiring decisions and capital requests further out.
Then pick one planning unit and stay with it. Machine hours, labor hours, cycles, or pieces per shift all work. The mistake is mixing them — quoting a piece count from one resource and an hour count from another in the same column, then wondering why the totals never reconcile. Convert setup time, run time, and demand into the same unit before you compare anything.
Estimate Demand Using Real Order Data
Build your demand baseline from the orders you have, not the ones you hope for. Confirmed orders and backlog are firm. Open quotes are uncertain — weight them by how often a quote in that range historically converts, and keep them in a separate column from firm demand so nobody mistakes them for commitments.
Layer in seasonality from your own history, customer commitments already made, and any new parts still in development. Write down the assumptions for new products, promotions, customers you may lose, and one unusually large order that would distort the average. An assumption written down can be argued with later; one buried in a spreadsheet cell cannot.
Calculate Usable Capacity by Bottleneck Resource
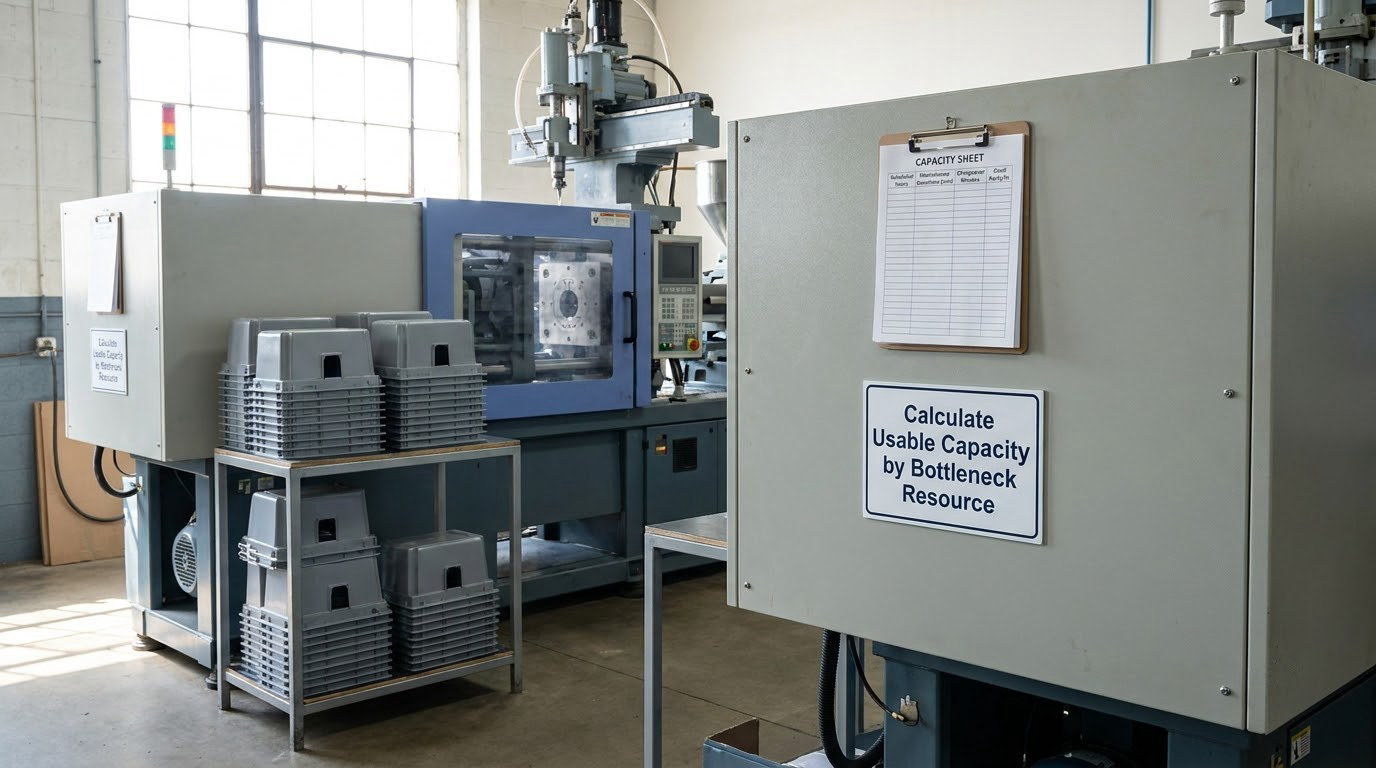
Usable capacity is not the number of hours on the calendar. It is the hours you can genuinely convert into good parts. Put these five formulas on their own lines and keep them visible, because most planning errors start with using the wrong one.
Available hours = scheduled hours − planned maintenance − planned shutdowns
Effective capacity in pieces = available hours × standard rate in pieces per hour × efficiency
Utilization = hours actually worked ÷ available hours
Efficiency = actual output ÷ standard output for the same hours
Takt time = net available time per period ÷ pieces the customer demands
Here is a worked example with two injection molding presses. Each runs a single shift, 8 hours a day, 5 days a week, so 40 scheduled hours per press and 80 across the cell. Subtract 4 hours of planned maintenance on one press and 8 hours of changeovers — twelve setups at about 40 minutes each — leaving 68 hours. Apply an efficiency of 80 percent for minor stops, warm-up, and short cycles, and you get 54.4 productive hours. At a standard rate of 110 good pieces per hour, effective capacity is 5,984 good pieces per week.
Demand for that cell next month is 6,200 pieces. The gap is 216 pieces, or about 3.6 percent — a shortage, not a crisis. Knowing that number three weeks out is the difference between raising a price, moving a promise date, or adding a Saturday shift, instead of discovering the shortfall the week the truck is supposed to leave.
Map Demand to the Right Production Process
Compare demand against the specific resource that has to run it. Total factory hours are never the right comparison when part families share a machine, a mold, an operator skill, or an inspection step. A shop with 800 free machine hours and a 300-hour queue in front of one press does not have spare capacity.
| Part family | Monthly demand (pieces) | Run time per piece | Setup time | Required resource | Monthly available capacity |
|---|---|---|---|---|---|
| Housing, 4 cavity | 9,000 | 18 sec | 45 min | Press 1, 4-cavity mold | 7,700 pieces |
| Bracket, 2 cavity | 5,000 | 31 sec | 30 min | Press 1, 2-cavity mold | 3,900 pieces |
| Cap, 8 cavity | 14,000 | 11 sec | 60 min | Press 2, 8-cavity mold | 16,200 pieces |
| Insert, hand insert | 2,400 | 6 sec | 20 min | Cell 2 operators, 4 stations | 2,900 pieces |
Press 1 carries 9,000 plus 5,000 pieces of demand against roughly 11,600 pieces of capacity, and that is before setup time is added. Press 2 has room to spare, which tells you the shortage is about the wrong asset rather than too few assets — exactly the kind of thing a spreadsheet on machine totals hides.
Routings matter as much as run rates here. Inspection capacity, packaging, and material staging all constrain output, and parts carrying tight GD and T requirements often need longer inspection cycles than their run time suggests.
Compare Demand with Capacity and Find the Gap
Line up required capacity against usable capacity for every period, then sort each resource into one of three buckets: short, spare, or mismatched. Short means demand exceeds usable capacity. Spare means you have room. Mismatched means the total is fine but no single resource can make what the customer ordered — the housing shortage above is mismatched, not short.
Calculate utilization as demand divided by usable capacity for the period. Most small shops plan the constraint into the 80 to 85 percent range and leave the rest as buffer. Planning a press at 100 percent sounds efficient and behaves badly: the first breakdown, hot runner change, or rush order pushes real delivery dates, and every week you run flat out you have no room to absorb a bad day.
Takt time frames the same idea from the customer side. If net available time is 160 hours and the customer wants 2,000 pieces, takt time is 288 seconds — 4.8 minutes — per piece. Any resource that cannot reliably complete a piece inside that window, including setup, will limit you, even if its average run time looks comfortable.
Choose a Response for Each Shortage or Surplus
Work through responses in order of cost and risk, and stop at the first one that closes the gap.
- Resequence. Group like jobs together and push low-priority work behind committed orders. Free, and often overlooked.
- Reduce setup time. External setup work, staged tooling, and quick-change fixtures cut changeovers with no capital spend.
- Improve yield. Fewer rejects means more good pieces out of the same hours. A two point scrap improvement is free capacity.
- Add overtime selectively. Saturday shifts on the constraint only, for a defined number of weeks.
- Use outside processing. Send overflow to a contract manufacturer you have already qualified. Costs margin and adds a receiving step, but no capital.
- Buy material earlier. Sometimes the constraint is resin, not machine hours. Ordering inside the lead-time window protects the schedule.
- Cross-train labor. Widens the set of jobs any operator can cover and reduces the risk of a single-skill bottleneck.
- Adjust the promise date. The cheapest response of all, and the one shops avoid because it feels like a sales failure.
- Add equipment or a shift. The last option. Take it when the shortage repeats across several periods and the cheaper levers are exhausted.
Temporary responses are fine for a seasonal spike or a one-off large order. If the same resource shows a shortage every month, that is a structural problem, and it deserves a permanent fix rather than another year of Saturday shifts.
Review the Plan and Turn It into Action
A plan that stays in a file changes nothing. Convert it into requests with owners and dates: purchase orders tied to material lead times, an overtime request to the plant manager, maintenance windows in the shared calendar, qualified outside processors for overflow, and a priority list for delivery when two orders want the same week.
Then run a weekly capacity review, about an hour, with production, purchasing, and sales in the room. Compare actual output and downtime against the plan. Ask why the variance happened — a mold issue, a material delay, a rushed setup — and update the forecast and capacity assumptions to match. Numbers that never get challenged drift within a quarter.
Track a small set of numbers weekly: utilization on the constraint, OEE, average changeover time, queue length in front of the constraint, on-time delivery, and total WIP. Six numbers on a whiteboard beat a dashboard nobody opens.
Common Mistakes
Almost every capacity plan that fails does so for one of a handful of reasons. These are the ones I see most often in small shops.
Planning nominal hours instead of usable hours. Calendaring 40 hours per press and dividing demand by 40 produces a plan that breaks in week one. Subtract maintenance, changeovers, and a realistic efficiency factor first.
Ignoring setup and changeover time. On high-mix work, changeovers can eat a quarter of your scheduled hours. Measure your actual average, not the standard on the routing sheet.
Looking at one resource. Total machine hours across the plant can look comfortable while a single press or a single skilled operator is the real constraint.
Mixing planning units. Piece counts in one column and hours in another make every comparison meaningless.
Treating the forecast as firm orders. Weighted quotes counted at full value create phantom shortages, which lead to overtime and outside processing you did not need.
Leaving out maintenance and quality loss. No maintenance window in the plan means the first breakdown eats a promise date. Scrap and rework belong in the capacity math, not in a quality report nobody reads.
Running a fixed schedule that never changes. Capacity planning is a living document. A plan that was accurate eight weeks ago tells you nothing about today.
Planning to full utilization. Anything above roughly 85 percent on the constraint leaves no room for variation, and variation is the only thing you can count on.
Before you publish the plan to sales, purchasing, and production, walk this checklist: demand built from real orders, firm and uncertain demand separated, usable hours calculated for the constraint, setup and maintenance subtracted, every part family matched to its actual resource, responses chosen for each gap, and a review date on the calendar. Ten minutes against the checklist saves a month of chasing.
Frequently Asked Questions
What is manufacturing capacity planning?
Manufacturing capacity planning is the process of measuring what a plant can realistically produce in a given period, comparing that to expected demand, and adjusting labor, machines, schedules, or promises before the gap becomes a late order. In practice it means usable capacity by work center, not nominal machine hours, reviewed on a fixed weekly cadence.
How do I calculate production capacity?
Start with scheduled hours for the work center, subtract planned maintenance and shutdowns, multiply by your standard rate in pieces per hour, then discount by an efficiency factor for stops, warm-up, and short runs. That gives effective capacity. Compare it to demand for the same period and the difference is your capacity gap.
What is the difference between capacity planning and production planning?
Capacity planning answers whether you can produce the required amount, usually over weeks or months, using available hours, standard rates, and efficiency. Production planning answers what you will make and in what sequence, usually day to day, using the routing, the bill of materials, and the current order book. Capacity planning sets the ceiling; production planning works underneath it.
What utilization should a small manufacturer target?
Most shops plan the constraining resource into the 80 to 85 percent range and treat the remainder as buffer for breakdowns, rush orders, and normal week-to-week variation. Chasing higher utilization on the constraint is fine. Chasing it on every other resource just builds WIP in front of the bottleneck and lengthens lead times.
Do I need capacity planning software to get started?
No. Capacity planning basics for small manufacturers are usually handled in a spreadsheet with one tab per work center, one for demand, and one comparing them. Software becomes worth it when part families multiply across shared equipment, manual updates consume a full day each week, or you need finite loading you cannot build by hand.
Does outside processing count as capacity?
It can, but count it separately from your own capacity and cap it by what you can realistically receive and inspect. Outside processing buys you time rather than capability: it costs margin, adds incoming inspection, and depends on a supplier’s slot. Good for seasonal spikes, not a substitute for a structural shortage you see every month.
Conclusion
Start with one afternoon of work. Export your last 90 days of orders and your open backlog. List the usable hours for the resource that limits output — scheduled hours, minus maintenance and changeovers, times a realistic efficiency factor. Put both in weekly buckets for the next twelve weeks and compare them line by line.
Where you find a gap, take the cheapest response that closes it, and write the assumption behind it where someone else can see it. Where you find spare capacity, ask whether it is spare on the right resource before you relax any promise dates.
Capacity planning is not a one-time schedule. It is a short weekly conversation between production, purchasing, and sales about whether the plan still matches reality — and reality in a small shop changes every Friday. If you want more background on the quality side of the work, including compliance requirements that affect material lead times, the related manufacturing guides on this site cover that in detail.