
DMAIC is a five-phase, data-driven problem-solving framework used in Lean Six Sigma to improve a process that already exists but is not performing: Define, Measure, Analyze, Improve, and Control. Here is the DMAIC process step by step, including what each phase asks for, which tool to open, and the exit criteria that tell a team it is safe to move on. A well-run project takes four to six months; teams that rush it spend longer.
I have watched a lot of improvement projects go wrong in the same place. The team already knows what the fix should be, so Define gets treated as paperwork and the real work starts at Improve. Six months later the problem looks better and nobody can say why. If you want a structured alternative to that argument, the 8D problem solving process step by step guide covers a lighter-weight route for defect investigations that do not need a full belt project.
Table of Contents
- What You Need Before You Start DMAIC
- Step-by-Step: The DMAIC Process in Five Phases
- Frequently Asked Questions
- Are DMAIC the five phases of a Six Sigma project?
- What is the significance of the Define phase in DMAIC?
- Who is primarily responsible for process improvement in Six Sigma?
- What tools are used in the DMAIC analyze phase?
- How do you measure success in the DMAIC control phase?
- How long does a DMAIC project take?
- Where to Start
What You Need Before You Start DMAIC
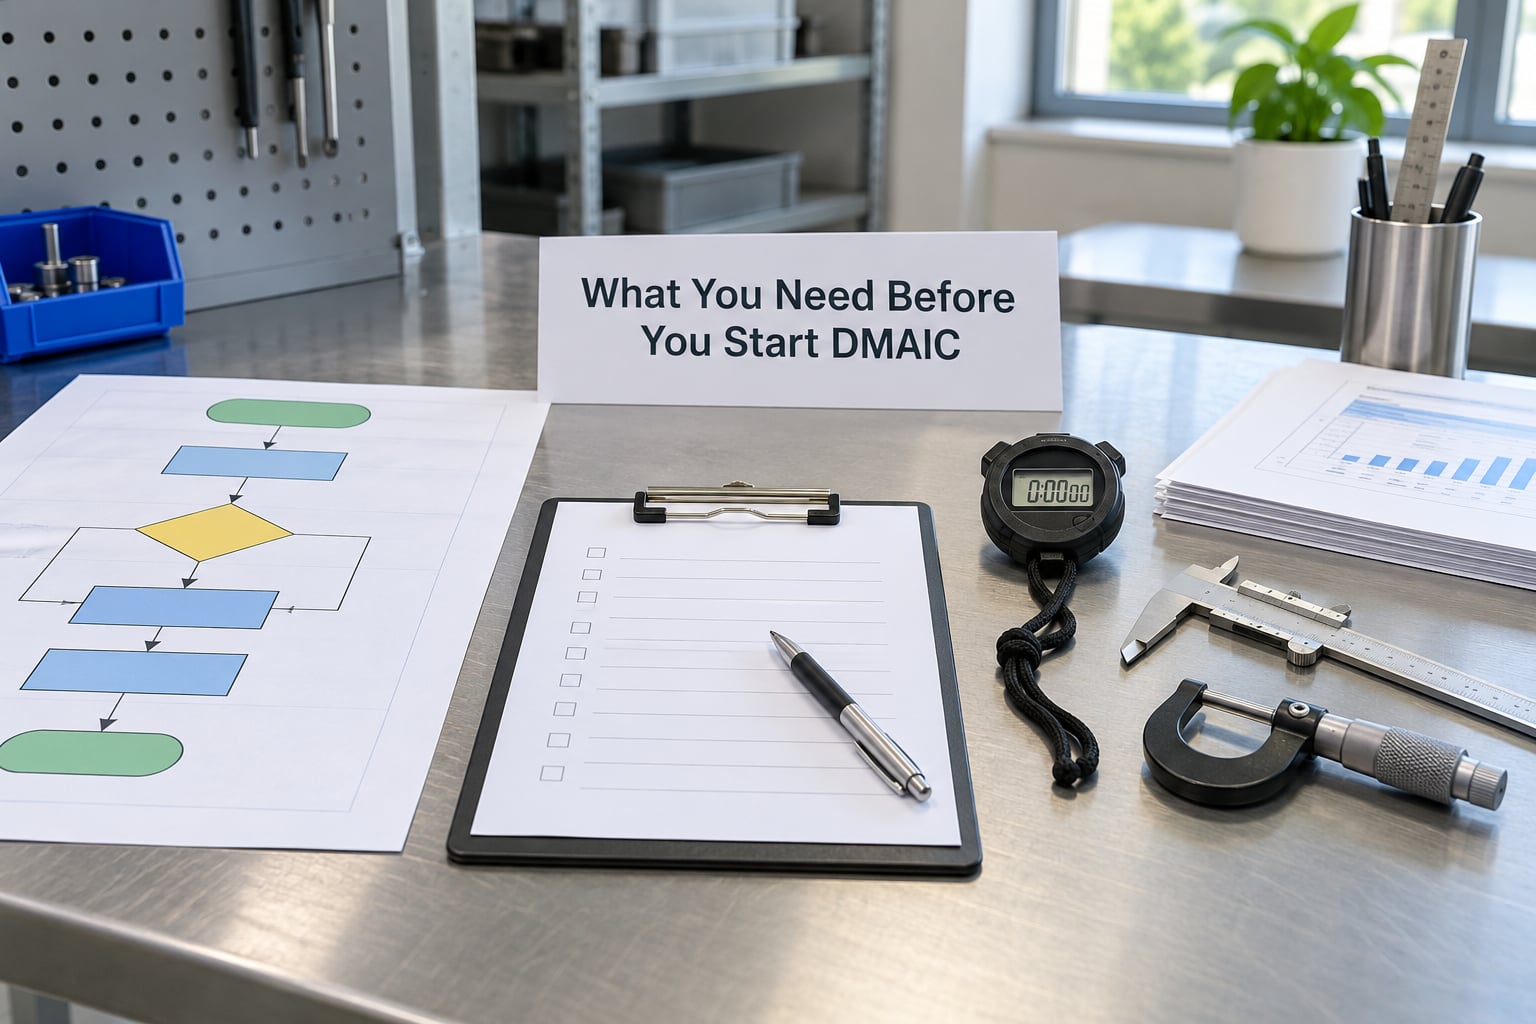
Most stalled projects are missing something from this list before they ever reach Define, and scrambling for it in Measure is what doubles the timeline.
- A sponsor with authority. Someone who can release people, approve spend, and change a standard. Without one, the project dies at the first scheduling conflict.
- A core team of three to five. Someone who runs the process daily, someone from quality or engineering, someone downstream who feels the output, and often one finance or customer-side voice to sanity-check the business case.
- Baseline data access. At least three months of defect, cycle time, or delivery records from the system of record, plus a plan for anything that is not captured today.
- A measurement system that can be trusted. If two operators measure the same part and get different answers, every later phase is built on sand. A quick gauge check or gauge R&R comes before any chart.
- Process documentation. Whatever exists: an SOP, a routing, a work instruction, or just a wall chart with the steps scribbled on it.
- Improvement tools. Nothing exotic. A spreadsheet or Minitab for data, a whiteboard for SIPOC and fishbone diagrams, a five-why worksheet, and a control plan template.
- Customer and stakeholder evidence. Complaints, returns, review comments, on-time delivery scores, whatever tells you what the market actually feels.
Step-by-Step: The DMAIC Process in Five Phases
Each phase exists to produce one specific input for the next. Read the list first, then take each phase in turn.
- Define: turn a vague complaint into a scoped, measurable problem statement. Common tools include a project charter, a SIPOC diagram, and Voice of the Customer data.
- Measure: capture a defensible baseline and map the current process. Common tools include a data collection plan, a process map, and measurement system analysis.
- Analyze: separate root causes from symptoms and rank them by impact. Common tools include a Pareto chart, a fishbone diagram, and 5 Whys.
- Improve: build, test, and select countermeasures against the verified causes. Common tools include pilot testing, design of experiments, and FMEA.
- Control: make the gain hold after the team disbands. Common tools include a control plan, updated SOPs, and SPC charts.
That is the DMAIC process step by step in one screen. The order matters because each phase gates the next: you cannot improve a cause you have not verified, and you cannot verify a cause with no baseline behind it. Teams who run phases out of order end up with countermeasures that address symptoms and control plans written against numbers nobody trusts.
DMAIC Process Step by Step: Define the Problem
The Define phase is the highest-leverage phase and the least respected one. It is where you write down what is actually wrong, for whom, and how much it is costing, before anyone proposes a solution.
- Collect Voice of the Customer. Complaints, return notes, warranty claims, survey scores, missed deliveries. This is what stops you optimizing a metric nobody outside the plant cares about.
- Map the scope with a SIPOC diagram. Suppliers, Inputs, Process, Outputs, Customers. Drawing it on a whiteboard in twenty minutes exposes half the scope arguments automatically.
- Write one problem statement. A good one reads: “Over the last three months, first-pass yield on line 4 averaged 88 percent against a 95 percent standard, driven mostly by short shots on the first 30 minutes of each run, which generates about 400 scrap parts a month.” Specific, bounded, measurable.
- Name the goal and the scope boundary. Which line, which shift, which product family. Also name what is explicitly out of scope, because that is where scope creep starts.
- Set the timeline and sign the charter. Charter, goals, roles, milestones, signed by the whole team and the sponsor before anyone touches data.
Exit criteria: a signed charter, a quantified problem statement, and stakeholder agreement on the goal. If the sponsor will not put a number on success, stop there and fix that first.
Practitioner forums keep raising the same worry about this phase: is it qualitative or does it need charts? It is mostly qualitative. Charts belong to Measure. Define needs evidence that the problem is real and matters, not a distribution.
Step 2: Measure the Current State
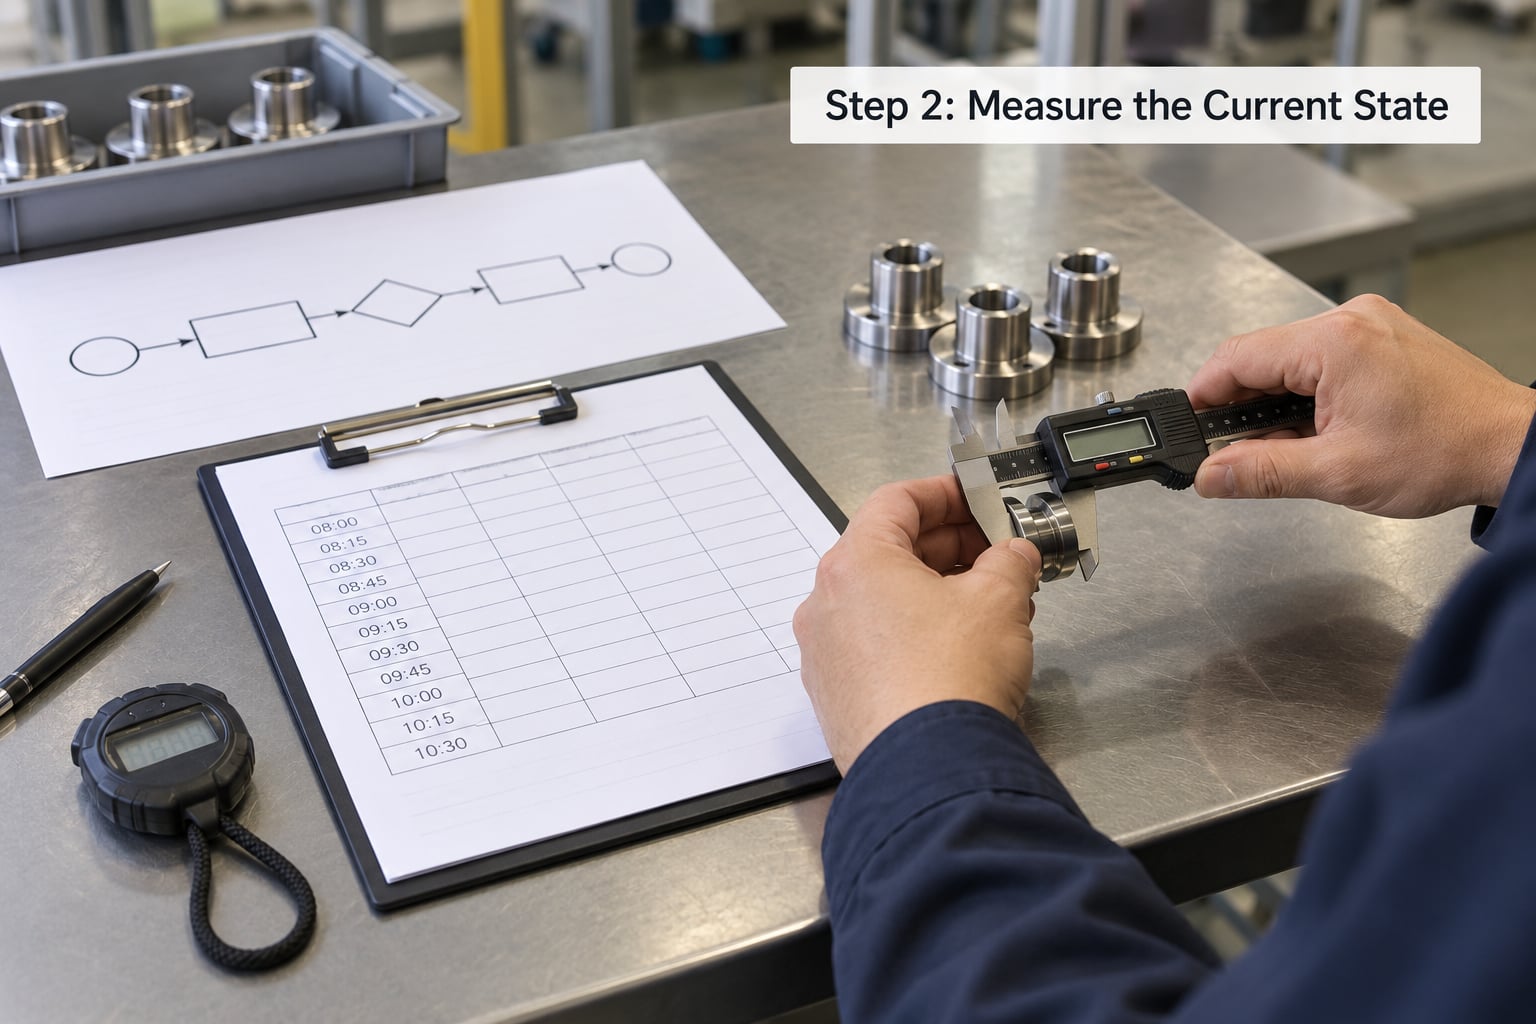
Measure builds the baseline you will be judged against later. It also exposes the moment where many projects discover their problem is not the one described in the charter.
- Write a data collection plan. What gets measured, by whom, with what method, how often, for how long, and where it lands. Ambiguity here costs weeks.
- Map the current process. Value stream mapping or a simple SIPOC-driven flowchart, including the handoffs, queue times, and rework loops people forget to mention.
- Check the measurement system. Gauge R&R or a repeatability check on whatever device captures your key metric. Ten minutes here routinely saves a month of arguing about data later.
- Collect and stratify. Pull the baseline, then break it down by line, shift, machine, operator, material lot, and time of day. Scrap that hides inside one shift and one material supplier looks like noise on a single average.
- Look at variation. Plot it. A control chart separates common cause variation, which is the process being itself, from special cause variation, which is something specific going wrong.
Exit criteria: a reliable baseline, a confirmed measurement system, and a current-state map the team agrees with. If the data contradicts the problem statement, go back to Define rather than pushing forward.
For plant-wide context, it helps to know how the process you are fixing contributes to overall equipment effectiveness; the OEE calculation explained step by step breaks down availability, performance, and quality separately.
Step 3: Analyze the Problem
This is the reality check phase. You are looking for the causes behind the variation you measured, and for the evidence that says which ones are worth attacking.
- Run a Pareto chart. Sort defect categories by count or cost and find the few that carry most of the loss. In most molding projects the top two or three defect types carry 70 to 80 percent of the scrap.
- Build a fishbone diagram. People, machines, methods, material, measurement, environment, and the process step. Get the operators who run the line to fill it in. They know where the problems are before any chart does.
- Apply 5 Whys to the top causes. Stop when you reach something you can control, not when you reach something that sounds deep. “Why did the short shot happen? Why? Why?” until the answer is a specific setting, tool, or material property.
- Test the causes you can quantify. Regression to show which factors track the defect rate, capability numbers such as Cpk to see how much of the spread is ours to control, hypothesis testing where you have clean before-and-after data.
- Write down what you ruled out. The causes the data cleared are as useful as the ones it confirmed, and it stops the team re-litigating them in Improve.
Exit criteria: a small set of verified root causes, each with evidence behind it. A fishbone full of guesses is not a result.
Step 4: Improve the Process
Now, and only now, does the team propose solutions. Every countermeasure should trace back to a cause you verified in Analyze, which is exactly how you spot the ones that were inserted too early.
- Generate countermeasures against the top causes. A mix of long-term structural fixes and quick wins. Long fixes take longer but survive; quick wins buy the team credibility while they work.
- Pilot on one line, one shift, or one lot. Run it long enough to see real variation, not just a good hour. Three days is usually too little to conclude anything.
- Measure the pilot against the baseline. Same metric, same method. This is the number that goes in the sponsor update.
- Test settings with design of experiments where you have several factors. When mold temperature, hold pressure, and cycle time interact, changing one at a time will find you a local improvement and miss the better one.
- Plan the rollout. Owner, steps, training, date, and what happens to the other lines. An improvement that lives on one machine is not a process change.
- Run an FMEA on the new setup. The new setup has failure modes the old one did not, and they will show up later if nobody writes them down now.
Exit criteria: a piloted change with measured results that beat the baseline by a margin the sponsor agreed to.
If your target is equipment effectiveness rather than a single defect count, the 8-step plan for improving OEE in a molding plant sequences the same work around downtime losses.
Step 5: Control the Improvement
Control is where most projects quietly fail. The team disbands, the new setting gets reset during a maintenance call, and the process drifts back to where it was six months earlier.
- Write a control plan. For each key characteristic: what is measured, how, how often, the control limits, the target, and who reacts when a point falls out.
- Update the SOP and standard work. If the improvement is not in the documented method, it is a rumor on the floor.
- Put charts on the wall and set response rules. Distinguish control limits from specification limits. Control limits come from the data and describe what the process is doing; specification limits come from the customer or the design and describe what you owe them.
- Hand ownership to the process owner. Named person, not a department. They run the response plan when a chart signals special cause variation.
- Schedule a review. Thirty, sixty, and ninety days after handover. This is what catches a control plan that only worked while the team was watching it.
- Update the management system. Feed the change into ISO 9001 records and any layered process audit so the audit does not find a contradiction.
Exit criteria: a signed control plan with named ownership, documented training, and a scheduled review date. Then close the project and pick the next one.
Common DMAIC Mistakes and How to Fix Them
- Jumping to solutions. The team arrives at Improve with an answer it already likes, so Define and Analyze become theater. Fix: require every countermeasure to name the verified cause it attacks, in writing.
- Scope creep after the charter. A project grows from one line to three and then stalls because nobody can say no. Fix: any scope change goes back through the sponsor, and the charter is re-signed rather than edited quietly.
- Optimizing an internal metric. Cycle time on a part the customer does not buy is a waste of a good project. Fix: Voice of the Customer evidence in Define, or no project.
- Skipping stakeholder engagement early. Define and Measure are done in a back room and announced later, so the people who do the work resist the change. Fix: put operators and downstream teams in the room during Define and Measure.
- Analysis paralysis on thin data. The team collects for months waiting for a perfect dataset. Fix: define the minimum data you need to act, collect it, and label assumptions as assumptions.
- Mis-selecting the project. DMAIC on a problem a one-week Kaizen burst would fix burns a quarter and a sponsor’s patience. Fix: screen for impact and difficulty before committing, and choose the lighter method when the problem is small and well understood.
- Ending at Improve. The gain shows up for a month and fades. Fix: no project closes without a control plan, named owner, and a review date on the calendar.
Two more judgment calls come up constantly. First, when the process itself is new rather than broken, DMAIC is the wrong frame and DMADV is the right one. Second, DMAIC used on problems it was never designed for is the most common criticism of Six Sigma programs overall: the framework is rigorous, and rigorous frameworks get turned into paperwork when nobody owns the result.
Frequently Asked Questions
Are DMAIC the five phases of a Six Sigma project?
Yes. DMAIC stands for Define, Measure, Analyze, Improve, and Control, and those five phases are the standard structure of a Six Sigma improvement project. Each phase has defined deliverables and exit criteria: a signed charter, a reliable baseline, verified root causes, a piloted change, and a control plan with named ownership. Teams sometimes run shortened or blended versions, but the sequence is what makes the method work.
What is the significance of the Define phase in DMAIC?
Define decides whether the rest of the project is worth running. It converts a broad complaint into a scoped, measurable problem statement grounded in customer evidence, and it sets the goal, timeline, and boundaries in a charter the team and sponsor both sign. Skipping it is the single most common failure mode, because the team then spends Measure and Analyze proving a problem nobody agreed on.
Who is primarily responsible for process improvement in Six Sigma?
Responsibility is shared, and the roles are usually clear. A Black Belt leads complex projects and coaches, Green Belts run improvement projects as part of their day job, and Yellow Belts work on smaller fixes within their own area. The process owner owns the result after handover and owns the control plan, and the sponsor removes barriers and approves resources. Without a named process owner, gains tend not to last.
What tools are used in the DMAIC analyze phase?
The core tools are a Pareto chart to rank causes by impact, a fishbone or Ishikawa diagram to brainstorm across machine, method, material, people, measurement, and environment, and 5 Whys to drill a cause down to something controllable. On top of those, teams use process capability numbers such as Cpk, regression analysis, and hypothesis testing when the data supports them. Simple Kaizen fixes belong in Improve, not here.
How do you measure success in the DMAIC control phase?
You measure success by whether the process holds the gain without the project team watching. That means SPC charts on the key characteristics, defined control limits, and a written response plan for anyone who sees an out-of-limit point. Reviews at 30, 60, and 90 days catch the usual failure mode, where a maintenance reset or a shift change quietly reverts the new setup.
How long does a DMAIC project take?
A typical project runs four to six months, with Define and Measure taking roughly a third of that and Control sometimes going on longer than planned because of handover. Complex projects with multiple sites or new measurement systems run longer, often eight months. Short is not the goal. Studies of failed efforts usually trace the cause to rushing Define or skipping Control, not to the timeline itself.
Where to Start
Pick one problem with a visible cost, a sponsor who will sign a charter, and a process owner who will keep the control plan. Write the problem statement in one sentence with a number in it, get it signed, and let Measure tell you whether the number is real. That is the DMAIC process step by step, and the discipline of doing the first two phases properly is what makes the last three worth the time.