
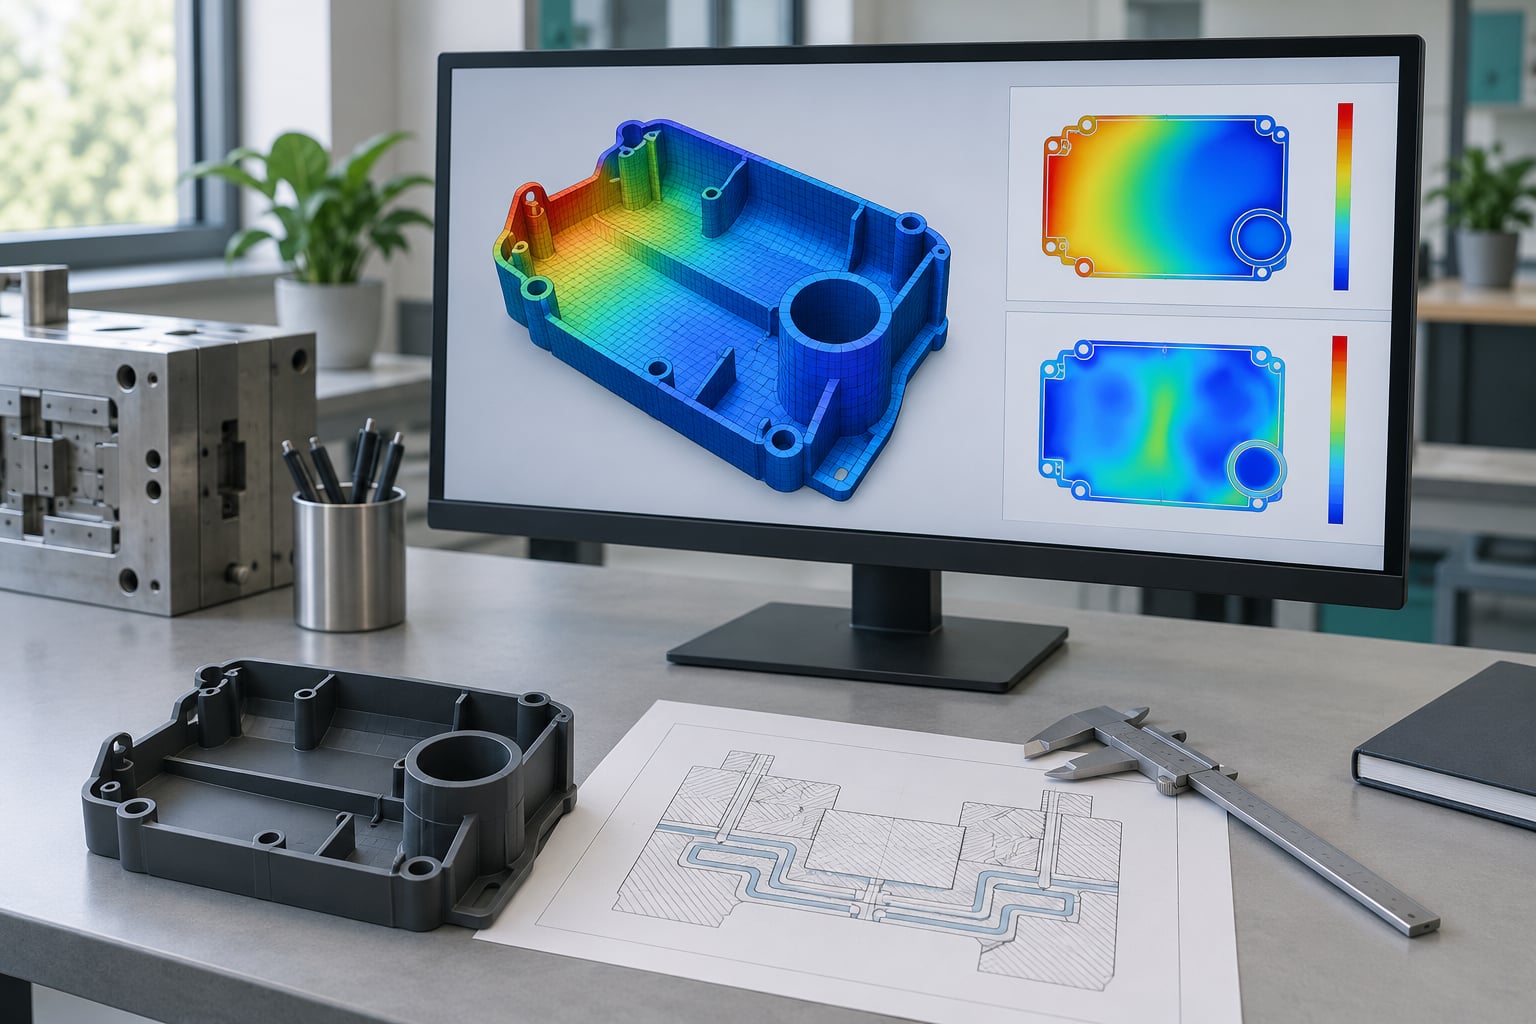
Mold flow analysis is engineering software that simulates how molten polymer fills, packs, cools and solidifies inside an injection mold. You feed it the 3D CAD geometry, a resin grade and a set of process conditions, and it returns colored result maps showing fill pattern, weld lines, air traps, shear rate, pressure drop, cooling time, volumetric shrinkage and predicted warpage.
This is a practical guide to mold flow analysis explained in engineering terms: what the software actually solves, what its result screens mean, where the predictions stop being reliable, and how to decide whether your next part needs one at all.
That is the whole promise of it: find the problems on a screen while changing a CAD file is still free, rather than on a press floor after a steel tool has already been cut and paid for. It also has a hard limit, and knowing where that limit sits matters as much as knowing what the software shows.
Below I walk through the whole method — what goes in, what comes out, how to read each result, and where simulation and a real mold trial should share the work. If you are new to it, the sections on inputs and results interpretation are the two worth your time. If you already run studies, the accuracy and troubleshooting sections are where the arguments get interesting.
One side note worth having open while you read: cooling behavior drives most of what people complain about later, so mold temperature control best practices for plastic parts is a useful companion reference.
Table of Contents
- What Is Mold Flow Analysis and What Does It Predict?
- How Does Mold Flow Analysis Work?
- What Inputs Are Required for a Reliable Analysis?
- How Do You Read Fill, Pack, and Cooling Results?
- What Mold Defects Can Mold Flow Analysis Identify?
- How Accurate Is Mold Flow Analysis?
- When Is Mold Flow Analysis Worth Running?
- Mold Flow Analysis vs Physical Mold Testing
- What Should You Do First When Results Look Wrong?
- Frequently Asked Questions
- Do I need mold flow analysis for every injection-molded part?
- Is mold flow analysis accurate enough to replace mold trials?
- What is the most important material data for mold flow analysis?
- Can mold flow analysis predict warpage and sink marks reliably?
- How long does a mold flow analysis take to complete?
- Should mold flow analysis be done before or after the DFM review?
- Conclusion: What to Do First
What Is Mold Flow Analysis and What Does It Predict?
Mold flow analysis is a CAE simulation that predicts how molten polymer fills, packs, cools and solidifies inside an injection mold, so engineers can find defects and optimize the part, gate and process window before any steel is cut or any shots are run.
In practical terms the software takes three things as input: the part geometry as a 3D CAD model, a material (usually a specific resin grade from a supplier’s datasheet or a database), and process conditions such as melt temperature, mold temperature, injection speed, holding pressure and cooling time. From that it solves the flow, heat transfer and solidification, then hands back a set of result views.
The results people actually act on come down to six categories: where the melt goes and how it arrives (fill pattern and fill time), where the flows collide (weld lines), where gas gets trapped (air traps), where the material is stressed (shear rate, shear stress and pressure drop), where the part will end up dimensionally (volumetric shrinkage and warpage), and how long it takes to cool enough to eject.
Two things it does not do. It does not tell you whether your mold steel will deflect, crack or fatigue under clamping load — that is a structural FEA question, usually paired with the same CAD in a separate solver. And it does not replace first-article validation. Simulation narrows the range of process settings worth trying; a mold trial tells you which one actually holds up over a thousand shots.
How Does Mold Flow Analysis Work?
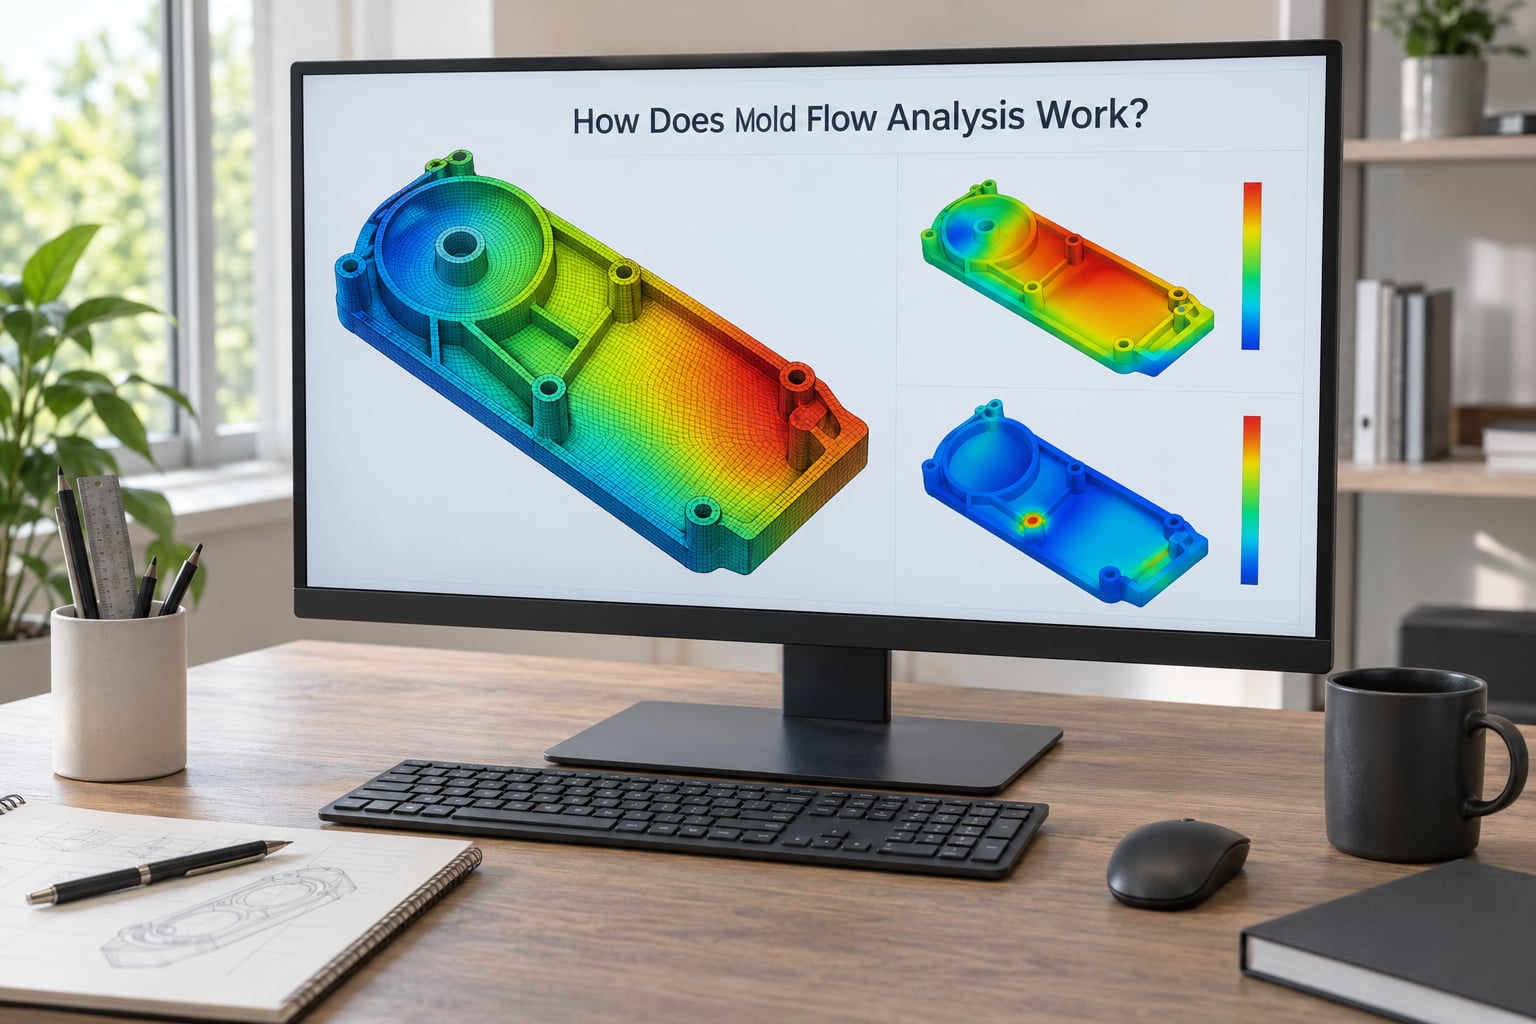
The workflow is consistent across the major packages, whether you are in Autodesk Moldflow Insight, Moldex3D, C-MOLD or Sigmasoft. The sequence matters more than the software, because most of the bad studies I have seen failed at geometry cleanup rather than at solving.
Step 1 — Import and clean the geometry. The part comes in from your CAD system, and the mold geometry is added as simplified bodies if the mold itself is available. Check draft angles, wall thickness transitions and any non-manifold geometry. Small modeling errors here turn into strange hot spots or unresolved mesh cells later.
Step 2 — Mesh it. The geometry is divided into finite elements, commonly tetrahedral or hybrid midplane meshes for shells. Element size is a real decision, not a default to accept blindly — smaller elements in thin walls and near gates resolve flow detail, but they add solve time. Engineers typically run a coarse study, find the areas that need resolution, then refine only there.
Step 3 — Assign the material. You select a resin grade and the software loads its rheology, density, specific heat, thermal conductivity and volumetric shrinkage. Custom grades and recycled or PCR resins often need measured data rather than the nearest catalog entry.
Step 4 — Set up the process. This is where gate location, gate size, melt temperature, mold temperature by region, injection speed profile, transfer pressure and time, packing pressure profile and venting go in. Cooling channels can be imported as geometry or approximated with a cooling-network model.
Step 5 — Solve. The filling phase is solved first, then the packing phase at constant or decreasing pressure, then solidification and cooling. Shrinkage and warpage prediction run off the solidified result.
Step 6 — Read results, then change something and rerun. A study you do not iterate on is a PDF nobody opens. The value is in the second, third and tenth run.
Here is what each input drives, and what the corresponding output is good for:
| Input | Software output | Decision it supports |
|---|---|---|
| CAD geometry and wall thickness map | Fill pattern and fill time | Whether the part can fill at all, or needs a bigger gate or higher melt temperature |
| Resin grade and viscosity curve | Shear rate and pressure drop | Whether flow marks, jetting or fiber breakage are likely |
| Injection speed and melt temperature | Weld lines and air traps | Where to move a gate, add a vent or shift a tie bar |
| Holding pressure and packing time | Volumetric shrinkage and sink marks | Packing profile and gate size needed to hit dimensions |
| Mold temperature and cooling channels | Cooling time and cycle time estimate | Channel layout changes, and whether the cycle time target is realistic |
| Fiber material data | Fiber orientation and warpage | Predicted anisotropic shrinkage direction and fixture strategy |
Notice that cooling time and cycle time are outputs, not inputs. People often ask the software to confirm a cycle time they already promised a customer, and get an unwelcome answer.
What Inputs Are Required for a Reliable Analysis?
Reliability in a mold flow study comes down to input honesty. A solver will happily return clean colorful results from data that has no relationship to your resin, and engineers sometimes treat that output as evidence. So let’s rank the inputs by how much they move the answer.
Resin rheology matters most. Flow in thermoplastics is shear-thinning: viscosity drops as shear rate rises. That relationship is described by a viscosity curve, often called a PVDF for the pressure, volume, temperature and flow conditions it was measured across. Catalog curves are measured at low shear rates; molding runs at far higher ones, so extrapolated values at the gate can be off by a factor that changes your pressure drop estimate substantially. Where the consequence is high — thin walls, long flow paths, high packing pressure sensitivity — use grade-specific data from the supplier or your own rheometer runs.
Temperature split and thermal properties matter a lot. Mold temperature by region, melt temperature, and the material’s specific heat and thermal conductivity all drive solidification timing. Assumption options matter too, since mold conductivity and interfacial contact resistance are often the crudest inputs in the whole model.
Process settings come from real machine data where you can get it. Idealized fill is useful for comparing gate sizes. Actual fill uses your injection speed profile and transfer point, and those come from the machine’s own velocity and pressure traces.
Geometry completeness changes the verdict. Gate size and location, runner and sprue dimensions, cooling channel placement and vent positions are inputs, not decoration. An analysis with a gate in the wrong place will faithfully tell you the part cannot be molded, which is true but not useful.
Mesh density is a convergence decision. Check that your element size is small relative to the thinnest wall, and check the same study again at a finer size in the areas you are judging. If the fill time and peak pressure move noticeably when you refine, the original result was not converged.
Beyond the simulation itself, materials teams often pair flow results with hardness testing for plastics, because a molded part’s local stiffness history traces back to the same shear and cooling history the solver predicted. If material properties are in question for your program, start there.
Also worth stating plainly: resin data from a supplier datasheet is a starting point, not ground truth. Recycled and PCR grades in particular vary lot to lot, and qualifying them properly means re-running the study with the measured properties for the lots you are actually buying.
How Do You Read Fill, Pack, and Cooling Results?
Each result screen answers one question, and reading them out of order wastes time. Work the way the mold fills: filling, then packing, then cooling, then dimensions.
| Result | What it shows | What to look for |
|---|---|---|
| Fill pattern and fill time | Melt front position over time across the cavity | Uneven front arrival, late-filling pockets, and the thinnest section relative to the thickest |
| Pressure drop and pressure at wall | Resistive loss along the flow path | Pressure spikes at sharp corners and gate-adjacent area, and whether the machine’s capacity is realistically exceeded |
| Velocity and shear rate | Local flow speed and rate of shear | Thin-wall regions running above the resin’s recommended limit, which drive fiber degradation and surface marks |
| Temperature | Melt temperature through the cycle, including shear heating | Rise above the degradation limit at the gate or in thin sections, and excessive loss across a long path |
| Residence time | How long melt sits in the barrel before injection | Long residence with a pigmented or thermally sensitive grade, where color drift and black speckling start |
| Volumetric shrinkage | Volumetric contraction from melt to solid | Region-specific shrinkage unevenness, which is the root cause of most sink and warpage |
| Cooling time and cycle time | Time to reach ejection temperature, part by part | The section that governs the whole cycle, usually a thick boss or rib intersection, and whether channels reach it |
| Fiber orientation | Predicted fiber alignment direction | Directional shrinkage that fights the part geometry, especially around bosses and corners |
| Warpage | Predicted distortion after ejection and cooling | Magnitude and direction versus the part’s tolerance, and whether fixturing or a different gate would help |
Two habits make reading faster. First, always check the legend’s units and range before interpreting a color — a red zone that means “above your shear limit” on one screen means nothing on the next. Second, run the same result across a spread of process settings rather than one nominal case; a molding window sweep shows whether a part is robustly moldable or only works in a narrow corner, and those two situations look identical in a single-run report.
What Mold Defects Can Mold Flow Analysis Identify?
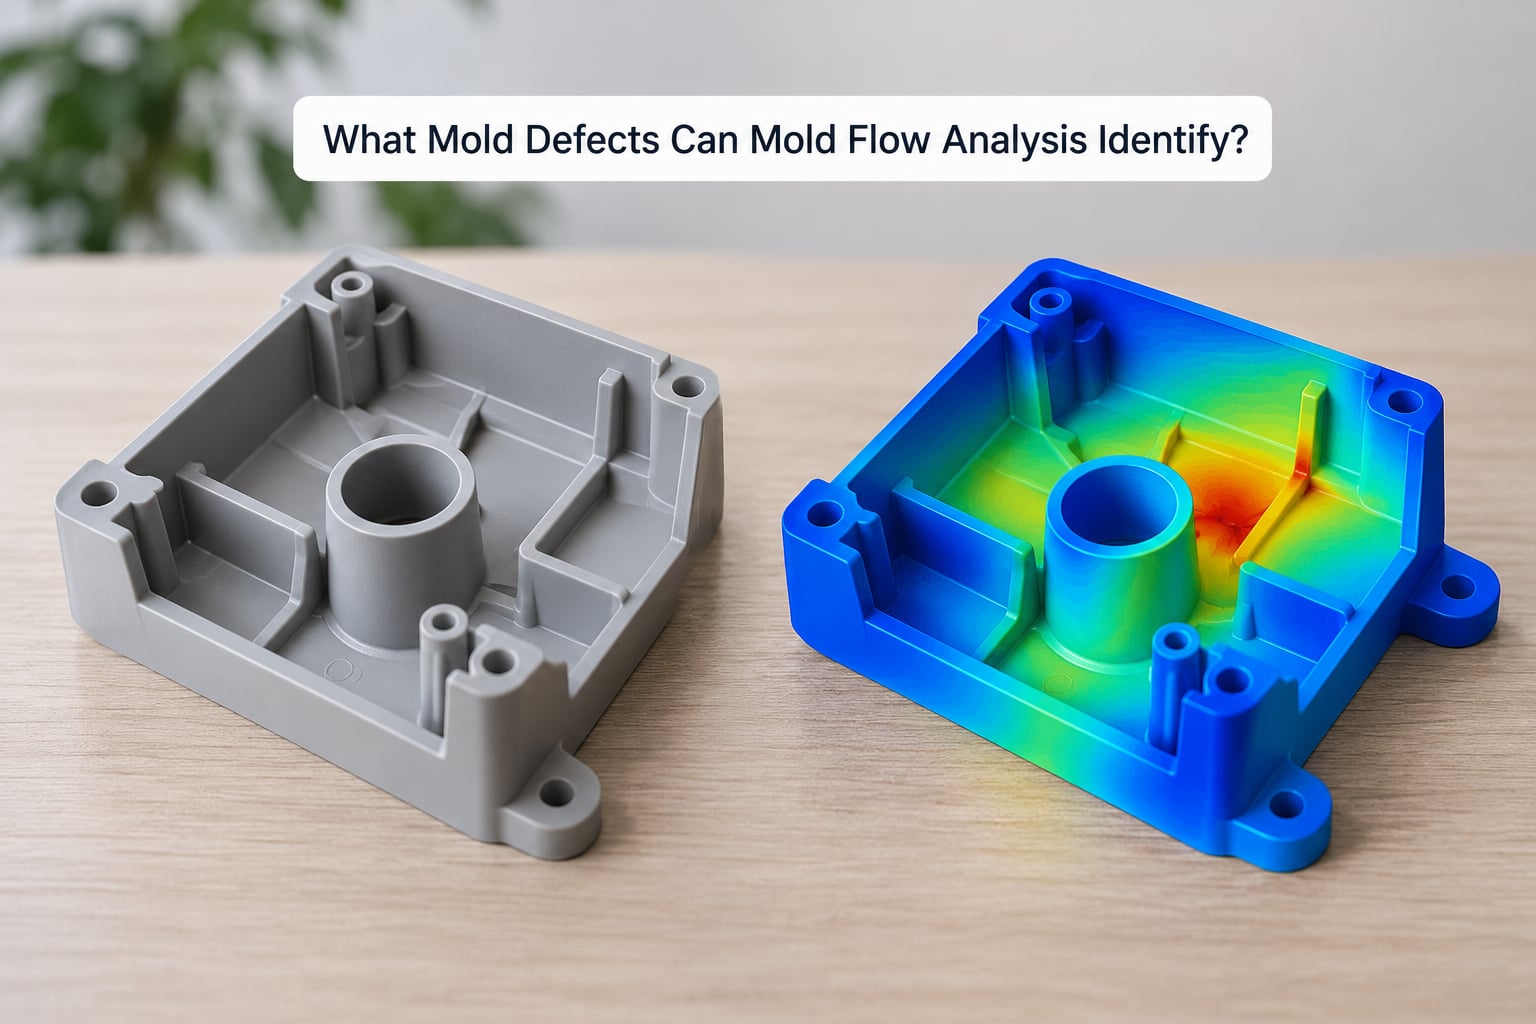
Each defect has a signature in the results. The table below is the version I keep next to a review screen.
| Defect | Likely cause | Simulation view that reveals it |
|---|---|---|
| Weld line | Two flow fronts meeting, releasing entrained gas at the collision | Fill pattern showing fronts converging on a single line; weld line result view |
| Jetting | Low shear at the gate, or a gate entering a large section too slowly | High shear rate at the gate followed by low velocity through the section |
| Air trap | Melt closes off a pocket before air can escape through a vent | Fill pattern with a closing front at the end of a dead-end flow path, plus vent positions |
| Short shot | Freeze-off or excessive pressure drop before the last section fills | Fill time exceeding available cycle, or peak pressure near machine capacity |
| Flow marks | Shear stress above the resin’s limit, or cold mold surface skin | Shear rate above the recommended limit at the wall, or low mold temperature at the surface |
| Burn marks | Air compression ahead of the front, or resin degradation | Trapped air at the end of fill, or temperature above the degradation limit |
| Sink marks | Local volumetric shrinkage in thick sections not reached by packing | Volumetric shrinkage concentrated in a boss, rib or pad, with the gate too far away |
| Flash | Melt pressure exceeding the clamping the parting line can hold | Pressure at the parting line relative to clamping force, especially at thin flash land areas |
| Warpage | Non-uniform shrinkage from uneven cooling, cooling channel layout, or fiber orientation | Volumetric shrinkage distribution, cooling time variation across the part, fiber orientation tensor |
| Fiber orientation-driven weakness | Fibers aligned across a load path by the flow history | Fiber orientation result view at the critical section |
The process fixes follow from the cause, not the symptom. A weld line moves when you relocate a gate or change the melt temperature to shift the front arrival; a sink mark responds to packing pressure and gate size, not to shear rate; and a jetting problem usually needs a gate that narrows faster or a gate that feeds a smaller section first.
How to tell a probable defect from a simulation artifact
Some results are strong predictions. A short shot caused by available pressure versus required pressure is close to arithmetic, and a fill pattern showing fronts colliding at one point is a geometric fact.
Others are directional. Warpage magnitude depends on cooling assumptions you may not have accurate, and fiber orientation predictions get fuzzy on complex geometry where the flow turns repeatedly. I treat those as a ranked risk list to verify, not a verdict.
Two checks help. First, refine the mesh in the region of interest and see whether the feature persists — many alarming hot spots are just coarse elements. Second, ask whether the finding appears under a realistic process window or only at one extreme corner of your sweep. A defect that shows up at a single setting is a setting to avoid. One that appears at every setting is a design problem.
How Accurate Is Mold Flow Analysis?
Accurate enough to be worth doing, and not accurate enough to skip the trial. That is the honest framing, and most engineers who run studies regularly land in the same place.
The sources of error are identifiable. Material models are fitted to limited shear rate and temperature ranges, which is why custom rheology data improves results most on difficult materials. Mesh density introduces discretization error that only a convergence check reveals. Mold construction assumptions — cooling channel position, heater or cooler control, steel thermal mass, insulation — are frequently crude, since a real mold’s thermal behavior is more complex than the channel layout implies.
Machine behavior adds its own gap. Real presses vary shot to shot through cushion, decompression and hydraulic or electric drive response, and the mold’s core temperature drifts through a shift in ways the study assumes as constant. Storage time between study and production also eats the value: a tool revised three weeks after the analysis was run is being run against stale data.
Validation closes the loop in a specific order. Run the mold, log injection pressure and cavity pressure with a transducer in a reference cavity, log cavity surface temperature at two or three points, then inspect first articles for the defects you flagged. Where prediction and part agree, you have a validated model you can reuse for process changes. Where they disagree, you have found the assumption worth fixing — and you have learned something about the model that the software cannot tell you.
Pressure trace comparison is the most informative single check. Matching the simulated cavity pressure curve to the measured one validates fill time, gate size, viscosity data and melt temperature all at once.
When Is Mold Flow Analysis Worth Running?
Worth running before steel is cut, always. Beyond that, the value scales with how much room there is for trouble. These are the cases where I would not skip it.
New tools for complex geometry. Anything with thin walls transitioning to thick sections, deep coring, or multi-plane parting is where surprises live.
Difficult materials. High-shrinkup grades, long glass fiber, high melt viscosity engineering resins, and any PCR or recycled grade where the data is uncertain.
Cosmetic or tight-tolerance parts. Visible surfaces, weld lines in the viewer’s eyeline, and dimensional control tighter than normal shrink variation. Where defect cost is high, upstream information is worth more.
Multi-cavity tools. Balancing flow and packing across cavities is exactly the kind of problem a study resolves on paper. If you are weighing a family mold against a single cavity tool, the family mold vs single cavity mold comparison pairs well with a balance study, because cavity count changes the flow path length and the cooling equation.
Warpage and dimensional complaints on an existing tool. Often the fastest return, because you already know the symptom and the study targets the cause directly.
Long-running production tools. Where cycle time reductions and process window widening compound over hundreds of thousands of shots.
And where it is not worth the effort: simple, thick-walled, single-cavity parts on a proven tool with a loose tolerance, especially in low volume. Existing tooling that already runs a stable process and only needs a material swap. In those cases trial runs are faster and cheaper than setting up the model.
Mold Flow Analysis vs Physical Mold Testing
The two are not competitors. Simulation answers “which of these five designs should we cut?” in an afternoon; physical testing answers “does this specific tool make acceptable parts?” over days of setup. Teams that treat either one as a replacement for the other pay for it.
| Criterion | Mold flow analysis | Physical mold testing |
|---|---|---|
| Purpose | Compare designs, gates and process windows before committing | Confirm that the built tool produces acceptable parts |
| Timing | Before tooling, days of work | After tooling, needs steel delivered and debugged |
| Cost per iteration | Low once the model and material data exist | High — press time, material, scrap, engineering hours |
| What it can change | Geometry, gate location, channel layout, process settings | Process settings, and geometry only via tool modification |
| Strength | Explores many options you would never afford to try physically | Captures everything the model omitted — real machine behavior, real material lots, real operator setup |
| Weakness | Only as good as the inputs; cannot model every real-world effect | Expensive, slow, and every trial teaches you one variable at a time |
The strongest pattern is a loop rather than a handover. Study the design, fix what the model shows, build the tool, run a controlled trial with instrumented cavity pressure and temperature, compare traces against the predicted curves, then feed the differences back into the next revision. Shops that do this shorten time to production in a way neither method achieves alone.
What Should You Do First When Results Look Wrong?
When a study produces something you do not believe, resist the urge to rerun with more mesh immediately. Work through this sequence instead, in order.
1. Check the material data. Confirm the resin grade, the source of its viscosity curve, and whether the shear rates at your gate fall inside the measured range. Bad rheology contaminates everything downstream, and it is the most common root cause I see.
2. Verify gates and vents. Confirm gate location, size and orientation against the CAD, and confirm vents are where you think they are. An analysis missing a vent will show an air trap that does not exist in the real tool.
3>Inspect mesh quality. Look for failed or distorted elements, check element size relative to the thinnest wall, and refine in the region driving the result. Re-run at a finer local size and see whether the finding survives.
4. Compare against actual machine settings. Pull real injection speed, transfer point, hold pressure and time, and melt temperature from the machine or the setup sheet. Studies routinely run against an idealized profile nobody actually uses.
5. Audit the cooling assumptions. Cooling time and warpage are only as good as your channel model. Check channel placement, whether the governing thick section has cooling reaching it, and whether mold temperature assumptions match what the mold will actually hold.
6. Run sensitivity cases. Vary the suspect input across a realistic range. If the result only appears at one extreme, it is a process setting to avoid, not a design flaw.
7. Validate the top findings physically. Pick the two or three highest-risk results and test those specifically on a controlled trial, with instrumentation if the decision is expensive enough to justify it. This converts a suspicion into evidence and tells you which model assumption to fix next.
Frequently Asked Questions
Do I need mold flow analysis for every injection-molded part?
No. It earns its cost on parts where a defect would be expensive or hard to remove: complex geometry, thin walls, high-shrinkup or fiber-reinforced resins, cosmetic surfaces, tight tolerances, and multi-cavity or high-volume tools. Simple thick-walled parts running on proven tooling with a stable process usually do not need a study, and trial runs will get you there faster.
Is mold flow analysis accurate enough to replace mold trials?
No, and engineers who treat it as a replacement learn the hard way. Simulation is reliable at ranking design options and at flagging where defects will occur. Trial and error remains the only way to confirm real machine behavior, actual material lots, operator setup effects and wear over a production run. The practical use is choosing which trials are worth running, not avoiding them.
What is the most important material data for mold flow analysis?
The viscosity curve, also called a PVDF, is the input that most changes the answer. It describes how melt viscosity falls as shear rate and temperature change, and it drives your pressure drop, shear rate and fill time predictions. Supplier datasheets are measured at low shear rates, so high-shear applications benefit from grade-specific data. Volumetric shrinkage and thermal properties are the next most influential.
Can mold flow analysis predict warpage and sink marks reliably?
Directionally, yes. Volumetric shrinkage results reliably show where thick sections will pull more than thin ones, which is the root of both sink marks and most warpage. The magnitude of predicted distortion is less certain because it depends on cooling assumptions, part stiffness and fixturing. Use the result to rank risk and choose cooling and gate changes, then confirm on first articles.
How long does a mold flow analysis take to complete?
A first study on a new part and mold typically takes a day or two, with most of that spent on geometry cleanup and setup rather than solving. Once a model exists and material data is loaded, an iteration on a process setting takes an hour or less, and a full design comparison of several gate options is a single afternoon. Solving time itself is usually minutes.
Should mold flow analysis be done before or after the DFM review?
After a basic DFM review, and before cutting steel. DFM catches rules-based problems like non-manufacturable draft, wall thickness below tolerance, or undercuts. Mold flow analysis catches what rules miss: flow balance, gate effectiveness, cooling-driven warpage and the process window. Running flow first on geometry that violates basic manufacturability wastes the study.
Conclusion: What to Do First
If you are starting a part now, fix the CAD geometry and the resin grade first, because nothing downstream is worth much until both are right. Then run one idealized filling study, look at the fill pattern and the volumetric shrinkage map, and change the two things they point at.
Do not treat that study as the sign-off. Build the tool, run a controlled trial with pressure and temperature logged, and compare the traces to the predicted curves. That comparison is where mold flow analysis stops being a pretty picture and starts being engineering evidence.