
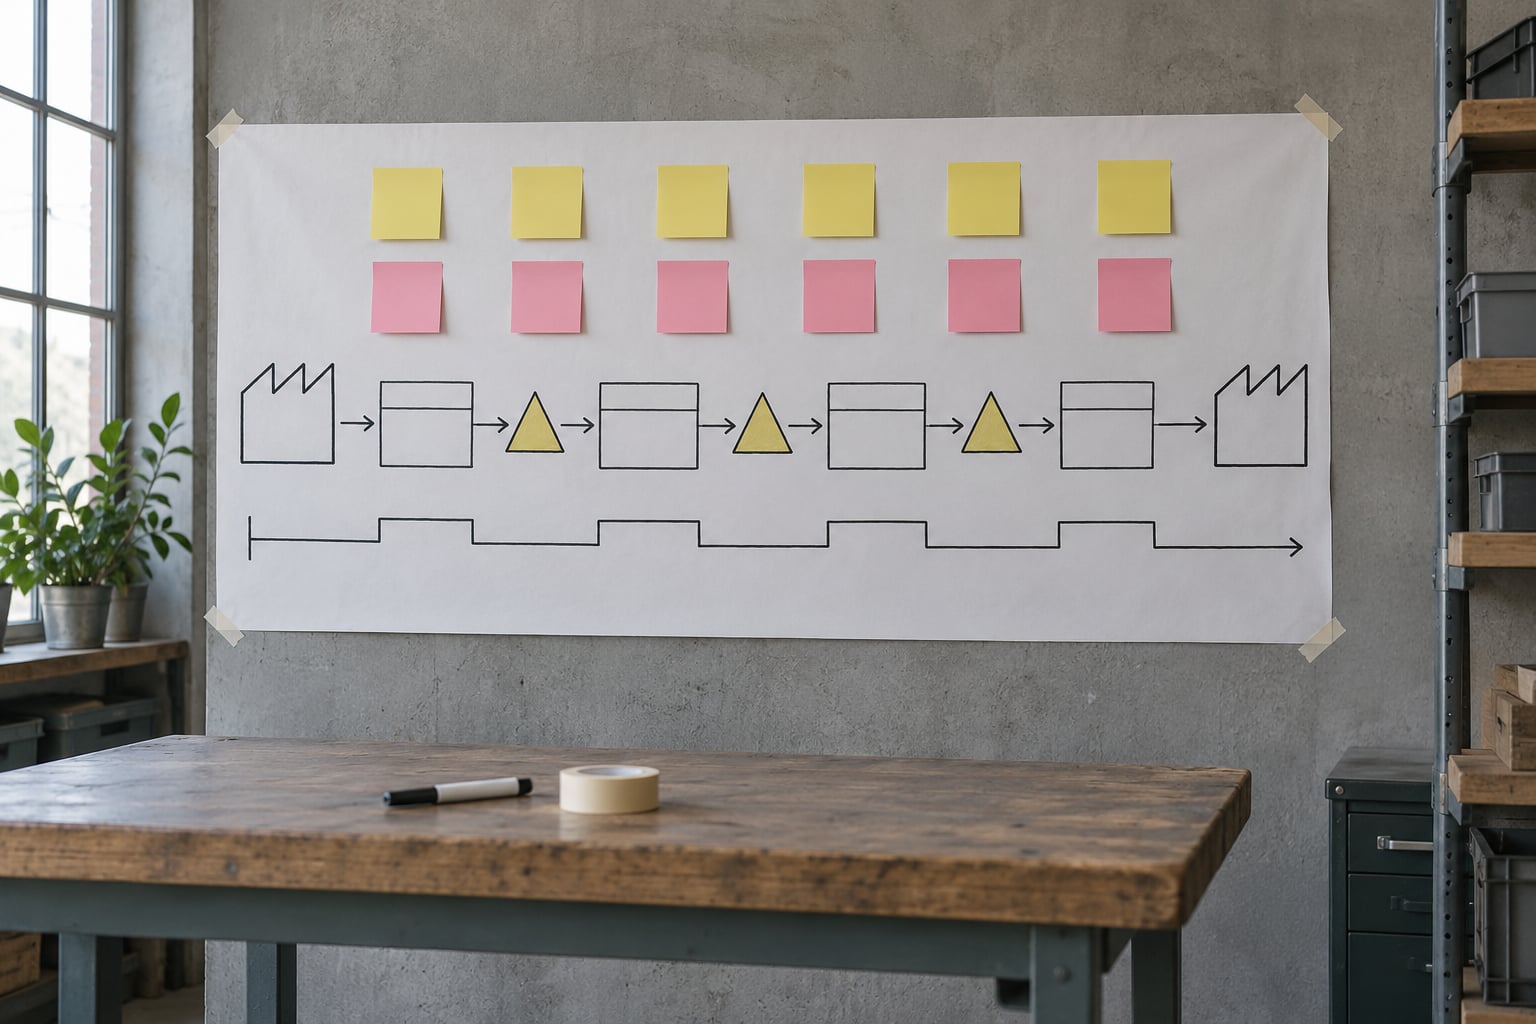
Value stream mapping step by step means drawing one product family end to end, recording real cycle times, queue times, and inventory at every step, then marking what is waste and drawing a leaner future state. The whole exercise takes about three days of preparation and one full day in a room with the people who actually run the line.
Here is the direct answer: value stream mapping uses a visual flowchart to document, analyze, and improve the steps required to deliver a product or service, separating value-added work from waste. It came out of the Toyota Production System, and Lean Enterprise Institute practitioners still teach it as the first diagnostic tool you reach for.
I have run these sessions in plastics, packaging, and fulfillment plants, and the same thing happens every time. Nobody argues about the future state until they see the current state drawn to scale on a wall. That gap between total lead time and actual processing time is what moves budgets. Where the numbers come from is covered in our OEE calculation explained step by step, and the equipment side of the story is in how to improve OEE in a molding plant.
Table of Contents
- What You Need
- Value Stream Mapping Step by Step
- 1. Define the Value Stream and Its Boundaries
- 2. Form the Cross-Functional Mapping Team
- 3. Gather Current-State Process and Performance Data
- 4. Draw the Current-State Value Stream Map
- 5. Identify Waste, Bottlenecks, and Process Gaps
- 6. Design the Future-State Value Stream Map
- 7. Calculate Lead Time and Compare Current With Future State
- 8. Create the Improvement Action Plan and Review Cadence
- Common Mistakes
- Frequently Asked Questions
- Conclusion
What You Need
Start with a written definition of the value stream, not a department name. One product family, one customer order type, one set of start and end points.
A cross-functional team of six to ten people is enough. Include operations, quality, engineering, planning, purchasing, logistics, and maintenance, plus at least one frontline operator from each process on the map. The operator matters more than the manager, because the operator is the only person who knows how long the real queue is.
Then collect your data sources before you book the room:
- Cycle time and processing time per step from machine logs or work order records
- Changeover times, sampled across several real changeovers rather than the standard
- Yield and scrap figures by defect code for the last quarter
- Inventory positions and average quantities at every point in the flow
- Current staffing levels and shift patterns per step
- Order lead time as the customer experiences it, from release to delivery
Your tools can be humble: a sheet of paper roll, tape, markers, and a wall. Software helps with versioning, not with thinking. If you are mapping an outsourced process, how to choose a contract manufacturer covers the questions worth asking about your partner’s own flow.
Finally, agree on one improvement objective before you start. Something like cutting total lead time from nine days to three, or raising first-pass yield above 97 percent. A map with no target becomes a very expensive poster.
Value Stream Mapping Step by Step
1. Define the Value Stream and Its Boundaries
Pick one product family and write down where the value stream starts and ends.
Start where the customer commits, usually the sales order or replenishment signal, and end where the customer receives a conforming product. In a molding plant, that often means customer order to shipped pallet. In a warehouse, it means pick release to dispatch confirmation. Resist the urge to include everything: a map of the entire factory usually ends up too wide to read and too vague to act on.
Use a process family matrix when you have many products. It is a simple three-column grid, product families down the side and process steps across the top, and it shows instantly which families share a common route. Map the family with the highest volume or the worst delivery performance first.
2. Form the Cross-Functional Mapping Team
Six to ten people from every function that touches the flow, with one named facilitator who does not report to anyone on the floor being mapped.
Walk the floor with the operators before the session. During the Gemba walk, ask them the questions that most mapping sessions skip: how many jobs are in front of yours right now, what makes you stop, how do you know which job to run next, how long does a rework loop take you, and where does material wait when nobody is working it. Answers to those five questions usually supply half the current state map.
Send the scope, the boundaries, and the data you need out in advance so people arrive with numbers instead of opinions. A team that has already seen the area is a team that can start drawing in the first hour.
3. Gather Current-State Process and Performance Data
Pull operating records first, estimates second, and label every estimate on the map as an estimate.
Cycle times and changeover times come from machine data where it exists. Uptime, downtime reason codes, and OEE come from the same records, and you can calculate them the way we show in the OEE guide above. Inspection points, hold and rework locations, and every point where material waits get marked physically during the walk.
Map the information flow as carefully as the material. Who sends the signal, how, and how long before the next process reacts? A paper traveler that takes two days to come back is often the largest single delay on the map, and it is invisible if you only draw the boxes.
4. Draw the Current-State Value Stream Map
Draw material flow left to right across three swimlanes, then draw information flow above and add a timeline ladder underneath.
The swimlanes separate physical transformation, information flow, and the value-add classification of each step. Use the standard notation below, and keep it to one wall.
| Symbol | What it means | Use it when |
|---|---|---|
| Process box | One transformation step, with cycle time, uptime, and staffing inside | Every physical step in the flow |
| Inventory triangle | A quantity of material waiting, labeled with units and days | Any point where more than one job or pallet sits |
| Data box | The information that triggers the step above it | Orders, schedules, kanban signals, inspection results |
| Material flow arrow | Physical movement, often thick and straight | Between adjacent process boxes |
| Information flow arrow | A signal or instruction, often thin or dashed | From customer or planning to any process |
| Timeline ladder | The lead time scale under the whole map | Always, so delay can be read off the page |
| Kaizen burst | A burst mark for a suspected waste point | Queues, holds, rework loops, excess inventory |
Below every process box, mark the step as value-added, necessary non-value-added, or waste. Necessary non-value-added work is not a target for elimination, it is a candidate for reduction, like inspection or a mandatory cure time. Then write the totals: total lead time across the ladder and total process time from the boxes.
The gap between those two numbers is the finding. Most processes spend under 5 percent of their lead time actually transforming material.
5. Identify Waste, Bottlenecks, and Process Gaps
Sort every step into value-added, necessary non-value-added, or waste, then attack the wastes that create queue rather than the ones that are merely visible.
The classic list applies directly to a value stream: overproduction, waiting, transportation, non-value-added processing, inventory, motion, and defects. The eighth waste, unused talent, shows up as work that exists only because one person’s habit has become everyone’s procedure.
Look for the constraint rather than the noise. Queue before a slow changeover, a quality hold area between two departments, a scheduling release that arrives after the material does, a machine with 70 percent uptime sitting between two fast operations. Then check the information flow for the failure that makes everyone buffer: if you do not trust the next process, you will overproduce, and overproduction creates the inventory you are complaining about.
6. Design the Future-State Value Stream Map
Redraw the map so that every process can run at takt, and remove the steps that only existed to fix the previous step.
Work forward from customer demand. Calculate takt time, then check each step’s cycle time against it. Any step slower than takt is either split, paralleled, or balanced with help. Any step faster than takt sits next to a decision point that can be worked as a two-position cell instead of a queue.
Design the pull logic as you draw. If demand is steady, a simple kanban card per part travels upstream from the last process, and each process makes only what the card authorizes. For high variety, use a pitch and a heijunka box so the schedule stays level rather than batching. Add mistake-proofing wherever a defect can pass downstream undetected, and add visual controls so an abnormality is obvious without reading a computer.
Write down the exception policy too. Someone has to decide what happens when a machine goes down, when quality rejects a batch, and when demand jumps. If you do not write that down, the future state quietly reverts to the current state.
7. Calculate Lead Time and Compare Current With Future State
Lead time is the full span on your ladder from release to delivery, and process time is the sum of what every box actually takes.
Process cycle efficiency is process time divided by lead time. That single percentage tells you how much room you have, and it is the number most likely to make a plant manager sit up.
Here is a worked example for a packaging line running one shift. Available time is 450 minutes after breaks. Customer demand is 600 units a day. Takt time is 450 divided by 600, which is 0.75 minutes, or 45 seconds per unit. The busiest packaging machine runs a 52-second cycle, so it cannot meet takt on its own and becomes the constraint. Summed processing time across all steps is 3.1 minutes per unit. Measured lead time from order release to dispatch is 9 days, roughly 9,000 minutes across two shifts.
Process cycle efficiency is 3.1 divided by 9,000, which is 0.03 percent. That is not a typo, and it is the kind of number that ends the debate about whether changeovers matter. The packaging line also holds about 1,400 units of work in process, which is roughly 2.3 days of output sitting between steps.
The future-state target for that same line is a 2-day lead time with 4.1 minutes of processing and 1,200 units of work in process. You can compare the two maps directly.
| Measure | Current state | Future state | How you close the gap |
|---|---|---|---|
| Lead time | 9 days | 2 days | FIFO sequencing at every step, no overlapping batches |
| Process time | 3.1 min | 4.1 min | Adds in-process inspection moved upstream from final audit |
| Process cycle efficiency | 0.03% | 0.14% | Rises as lead time falls, not as work is cut |
| Work in process | 1,400 units | 1,200 units | FIFO lanes and a defined max at each point |
| Changeover | 95 min average | 25 min | SMED on the packaging machine, external setup trial |
| Constraint | 52-second cycle vs 45-second takt | Cycle meets takt | Second position at the machine, help from the upstream step |
| Release method | Weekly push schedule | Kanban pull | Card size set from the two-day lead time target |
| Inspection | Final audit, plus rework loop | Inline, mistake-proofed | First-pass yield measured at the source |
Note that process time rises in the future state. That is normal and worth saying out loud in the room, because teams instinctively try to justify the new map by deleting work. You usually move inspection earlier, which adds touch time and removes the rework loop that was costing more.
8. Create the Improvement Action Plan and Review Cadence
Turn every kaizen burst on the future state map into an action with an owner, a date, and a measure.
A practical format is one row per action: the problem seen on the map, the countermeasure, who owns it, the measure that will move, and the due date. Keep it to the five or six actions that matter most, because a list of thirty will not get funded.
Then set the review cadence before you leave the room. Monthly review of the map itself, a 30-minute slot, the same wall. Re-draw the current state with real numbers after 90 days and compare it against the map. Put a laminated copy at the point of use and name a map owner, because a map that lives only in a facilitator’s laptop is a map nobody maintains.
Common Mistakes
The most expensive mapping error is trying to capture the whole factory. It produces a map nobody can read and a workshop that ends with agreement on nothing.
The second is drawing from the meeting room instead of the floor. Every map built from assumptions is wrong in the same direction, and it usually flatters the department that drew it.
The third is treating an activity list as a value stream. Listing twenty tasks in a column is not mapping. A value stream shows transformation, information, waiting, and inventory on a single timeline.
The fourth is mapping equipment instead of flow. Knowing the machine model matters less than knowing what queues in front of it, what triggers it, and how long material waits after it.
The fifth is ignoring information flow entirely. Boxes alone cannot show a scheduling system that releases work two days late, and that failure is frequently the biggest constraint on the map.
The sixth is presenting an unflattering current state as an attack. Practitioners on lean forums are blunt about this: the purpose is to show how dysfunctional the current system is, not to score departments. Put the operators on the team that draws it and the room turns with them.
The seventh is a future state with no implementation support behind it. If nobody owns the funding, the countermeasure, or the deadline, the map goes on the wall and stays there.
A few habits keep sessions productive: keep the map to one wall with three swimlanes, insist on real numbers, and mark estimates as estimates. If you only take three things from this guide, take those.
Frequently Asked Questions
What are some tools for value stream mapping?
You need very little. Paper, markers, tape, and a wall work better than most software, because the value is in the conversation. Visio, Lucidchart, draw.io, and Planview are useful when you want version control and shared editing across sites. Specialized lean suites add metrics libraries and live production data, which helps after the first map once you start updating it monthly rather than once a year.
What is the main purpose of VSM?
The main purpose is to make delay, waste, and rework visible so a team can act on them. A process usually spends a tiny fraction of its lead time actually transforming material, and that gap is invisible on a spreadsheet or an org chart. Drawing the current state puts the total lead time next to the total process time, and the difference becomes the case for change.
What are the 7 wastes in value stream mapping?
The seven wastes are overproduction, waiting, transportation, non-value-added processing, inventory, motion, and defects. An eighth, unused talent, is often added in lean programs. On a value stream map each one looks different: overproduction shows as inventory piles, waiting shows as queue time on the timeline ladder, defects as rework loops, motion as people walking, and non-value-added processing as steps nobody would pay for.
Is VSM part of Lean Six Sigma?
VSM is a Lean tool, and Lean Six Sigma uses it as a Define or Measure phase method inside DMAIC. A Six Sigma project typically maps the value stream first to find the highest-impact problem, then runs structured measurement and statistical analysis on that problem. The map tells you where to look, DMAIC tells you how to prove the fix worked.
What is the difference between a current state map and a future state map?
The current state map shows reality as it is today, built from observed data: real cycle times, real queues, real inventory. The future state map shows the redesigned process that meets takt time with pull flow, leveled production, and mistake-proofing. Both are needed, because a future state drawn without a true current state is a wish list rather than a plan.
How long does a value stream mapping workshop take?
Plan on a full day in the room with the team, plus two or three days of preparation and data collection beforehand. If the value stream is simple, such as an order-to-dispatch flow in a warehouse, a half day is realistic. Large multi-process streams spanning several departments usually take two sessions, because a single long day loses people after the fourth hour. Then budget a 30-minute monthly review to keep the map alive.
Conclusion
Pick one product family, name the boundaries, and pull twelve weeks of real cycle time and inventory data before you book anything. Those two steps take most of the work and none of the theatre.
Then run the session with the operators in the room, draw the current state honestly, and let the lead time versus process time gap do the arguing for you. Review the map monthly with the same wall and the same people. That cadence is what separates a real value stream mapping step by step exercise from a poster nobody looks at again.