

Sales and operations planning (S&OP) is a monthly cross-functional business process in which sales, marketing, supply chain, production and finance agree on one demand plan, convert it into a feasible supply and financial plan, and have executives approve a single operating plan for the company. It runs on a rolling twelve-month window with a strategic layer that reaches 18 to 36 months out.
The sales and operations planning process explained in plain terms is a decision cycle, not a reporting exercise. The output is a balanced plan the business can actually build and sell, plus a short list of named decisions with owners and dates. Updated for 2026, this guide walks the whole cycle as a small manufacturer would run it.
Table of Contents
- What Is the Sales and Operations Planning Process?
- Why Manufacturers Use S&OP
- The Sales and Operations Planning Process Step by Step
- What Data and Tools Does S&OP Need?
- S&OP Planning Cadence and Meeting Structure
- How to Run a Plastic Manufacturing S&OP Meeting
- S&OP Metrics and KPIs
- Common S&OP Mistakes and Fixes
- Frequently Asked Questions
- Conclusion: Start With One Product Family
What Is the Sales and Operations Planning Process?

S&OP is the monthly rhythm that turns a demand forecast into a committed operating plan. Sales and marketing bring what customers say they will buy. Operations brings what the plant, the tooling and the suppliers can produce. Finance brings the margin and cash consequences. The meeting forces those three views into one number per product family, and an executive approves the trade-offs.
It exists because the departments optimise different things. A sales rep is measured on bookings, a plant manager on schedule attainment, a buyer on purchase price variance and a CFO on cash. Without a forum where all three answers land in the same spreadsheet, the gaps show up later as expedites, overtime and slow-moving stock.
Four adjacent processes sit inside or beside S&OP, and mixing them up is the most common source of confusion:
- Demand planning owns the statistical forecast and the consensus forecast. It produces the demand plan; it does not decide what the business will commit to.
- Supply planning owns the supply plan: capacity, inventory, material and supplier constraints, and the resulting cost to serve.
- Production planning and MRP turn the approved supply plan into schedules, work orders and purchase orders. They operate below S&OP, at day and week granularity.
- Financial planning owns the operating plan in pounds, euros or dollars. It tests whether the supply plan supports the margin and cash targets.
Demand planning and supply planning feed S&OP. Financial planning validates it. Production planning executes it. That hierarchy is why an S&OP meeting cannot simply be a production review with sales in the room.
Why Manufacturers Use S&OP
Manufacturers adopt S&OP because the failure modes it addresses are expensive and none of them belongs to a single department.
Forecast error compounds. A forecast that is 15 percent low does not translate into a 15 percent shortage. It turns into lost line time, a rush resin order, and an expedite charge, and it damages the customer’s trust in your delivery date for the next twelve months.
Excess inventory hides everywhere. Slow-moving resin, obsolete colour runs and finished goods built for a promotion that slipped all carry holding cost and eventually write-offs. Nobody owns this cost, so it accumulates quietly.
Stockouts and late orders are usually a plan failure, not a sales failure. When a shortage was visible six weeks earlier and no one had authority to act, the resulting revenue loss is a decision-rights problem.
Production conflicts surface late. Two high-volume jobs land on one injection machine in the same week. If that is discovered after the schedule is released, the recovery options are overtime, a changeover penalty, or a late delivery.
Supplier lead times hide capacity risk. A six-week resin lead time means next quarter’s plan depends on decisions made this month. That is why S&OP carries a strategic horizon of 18 to 36 months and a rolling twelve-month tactical window.
Forum threads on r/supplychain and r/manufacturing describe the same pattern repeatedly: the meeting turns into a war zone where each function defends its own number, then becomes a data presentation with no decisions made. Both failure modes trace back to the same cause, which is no agreed process and no named owner.
The Sales and Operations Planning Process Step by Step
The canonical S&OP cycle has six steps, and they repeat every month. The names below are the standard ones used across the industry, so you can map your own process onto them directly.
Step 1: Prepare the S&OP Review
The demand planner issues the pre-read a week before the cycle starts. It contains the current statistical forecast, the rolling consensus forecast, customer orders and their changes, inventory positions by product family, the existing production plan, capacity data, the prior cycle’s open action items, and a supply-demand gap summary. Supply planning and finance add their own sections. Everyone walks in having read the same document, so the meeting is not spent hearing the numbers for the first time.
Step 2: Validate and Approve the Demand Plan
Sales, marketing, finance and operations challenge the forecast by product family, customer, region and promotion. The demand planning team records each challenge with a reason: known promotions, plant shutdowns, a competitor entry, a lost account, a new product launch, or a customer that consistently calls off 20 percent above their stated plan. Once those reasons are documented, the team produces one consensus forecast. A number with no challenge history is just a statistic; a challenged and signed-off number is a commitment people will defend in the executive meeting.
Step 3: Compare Demand with Supply
Supply planning translates the approved demand into production and material requirements, then tests them against real constraints: available labour and shifts, machine hours, tooling availability, resin and component supply, supplier capacity and lead times, and finished-goods warehouse space. The output is a supply-demand balance sheet per product family, showing a surplus, a shortage or a match, plus the cost of closing the gap. If your plant has never written that balance out, start with capacity planning basics for small manufacturers before the first cycle.
Step 4: Resolve Gaps and Trade-Offs
The pre-S&OP meeting is where the gap gets priced, not just reported. Realistic options for a shortage include overtime, an extra shift, rescheduling a lower-volume job, an alternate approved material, a supplier change, or reallocating stock from another region. Realistic options for a surplus include reducing future orders, running down inventory first, deferring a capital purchase, or phasing a product out. Finance attaches the revenue, margin, working-capital and cash impact to each option so the executive team can choose with numbers in front of it.
Step 5: Make and Approve the Executive Decision
The executive S&OP meeting is a decision forum, not a status briefing. Its output is one balanced business decision covering service level, inventory, cost, cash flow and strategic priorities, including which scenarios get funded and which get stopped. Anything below product-family detail belongs in the pre-S&OP minutes, not on the executive agenda. Executives should leave having approved a plan, approved a scenario, or or asked for a specific piece of analysis, and nothing else.
Step 6: Communicate, Execute, and Measure
The approved plan and every decision from the meeting are published within 48 hours: the new consensus forecast, the supply plan, the scenario that was chosen, the actions with owners and due dates, and the exception triggers that will bring an item back to the table. Purchasing works from the material plan, the plant schedules from the supply plan, customer service answers from the consensus forecast, and finance updates the operating plan. A month later, the same cycle reports results against the plan the executives approved.
Here is the same cycle as a table, which is the format most planning teams keep on a wall:
| Step | What happens | Owner | Output | Timing |
|---|---|---|---|---|
| 1. Prepare | Assemble forecast, orders, inventory, capacity and open actions | Demand planner with S&OP manager | Pre-read pack | Week 1 |
| 2. Demand review | Challenge and approve the consensus forecast by family | Demand planning, sales, marketing | Approved demand plan | Week 2 |
| 3. Supply review | Match demand to capacity, material and supplier limits | Supply planning, plant, purchasing | Supply plan and gap | Week 3 |
| 4. Pre-S&OP | Price each gap-closure option with finance | S&OP manager, finance business partner | Scenarios with costs | Week 3 |
| 5. Executive S&OP | Approve one balanced operating plan | Executive sponsor (CEO, COO or CFO) | Decision log and scenarios | Week 4 |
| 6. Execute and measure | Publish the plan, run it, track the measures | All functions, owned by the S&OP manager | Actions, owners, KPI review | Ongoing |
What Data and Tools Does S&OP Need?
You need five data sets to run the process, and they need one owner each. If two systems disagree about inventory position, the cycle burns a month on arguments that a decision could have settled.
- Demand data: statistical forecast, customer order history, open orders, quote and pipeline data, promotional calendar.
- Supply data: capacity by work centre and shift, tooling availability, material lead times and supplier commitments, scrap and yield rates.
- Inventory data: on-hand, on-order, allocated, in quality hold, and slow-moving stock by family and location.
- Financial data: margin per family, cost to serve, working capital and cash impact of each scenario.
- Execution data: schedule attainment, premium freight, expedite spend, OTIF and action-item closure from the previous cycle.
Plan at three horizons. The strategic layer covers 18 to 36 months in coarse buckets, which is where capital, capacity additions, sourcing and portfolio decisions live. The tactical layer is the rolling twelve-month window the monthly cycle actually plans to. The operational layer below it belongs to MRP and the shop floor.
Granularity matters more than accuracy. Plan by product family, not by part number, or the meeting drowns. A plastics converter with 400 SKUs will not debate 400 forecasts; it will debate six families and let the planner roll them up.
Most plants start with an ERP export into a shared workbook and succeed for a year. The point at which spreadsheets break is when several functions maintain their own version of the plan. When that happens, integration work or a single shared planning model is worth the effort, and it helps to understand how a digital twin works in manufacturing before committing to a large platform.
S&OP Planning Cadence and Meeting Structure
A monthly cycle works because the forecast moves and the answer moves with it. Weekly execution meetings handle exceptions; the monthly cycle handles the plan. A quarterly cycle with monthly preparation is the usual starting point for a first-time S&OP.
| Week | Activity | Who |
|---|---|---|
| Week 1 | Data refresh, load the previous cycle’s KPI report, open action review | S&OP manager, planners |
| Week 1 | Pre-read pack issued | Demand planner |
| Week 2 | Demand review; challenges logged and resolved; consensus forecast approved | Sales, marketing, demand planning |
| Week 3 | Supply review; capacity, material and tooling constraints applied | Supply planning, plant, purchasing |
| Week 3 | Pre-S&OP; scenarios priced | S&OP manager, finance |
| Week 4 | Executive S&OP; decisions approved and logged | Executive sponsor and functional leads |
| Week 4 | Plan published; actions assigned with owners and dates | S&OP manager |
| Weekly | Exception meeting: new demand signals, supply breaks, aged actions | Planners and leads only |
What the Sales and Operations Planning Process Delivers Every Month
Every cycle should end with the same five artefacts: a consensus forecast, an approved supply plan, a signed decision log, an action list with owners and dates, and a KPI report comparing actuals to the plan you committed to last month. If a cycle produces a deck and nothing else, it is a reporting meeting wearing a planning name.
Three facilitation rules keep it honest. Send the pre-read 48 hours ahead and refuse to present it live. Spend the executive hour on decisions only. And write down who said what a decision was based on, because that record is what makes the next cycle’s forecast argument shorter.
How to Run a Plastic Manufacturing S&OP Meeting
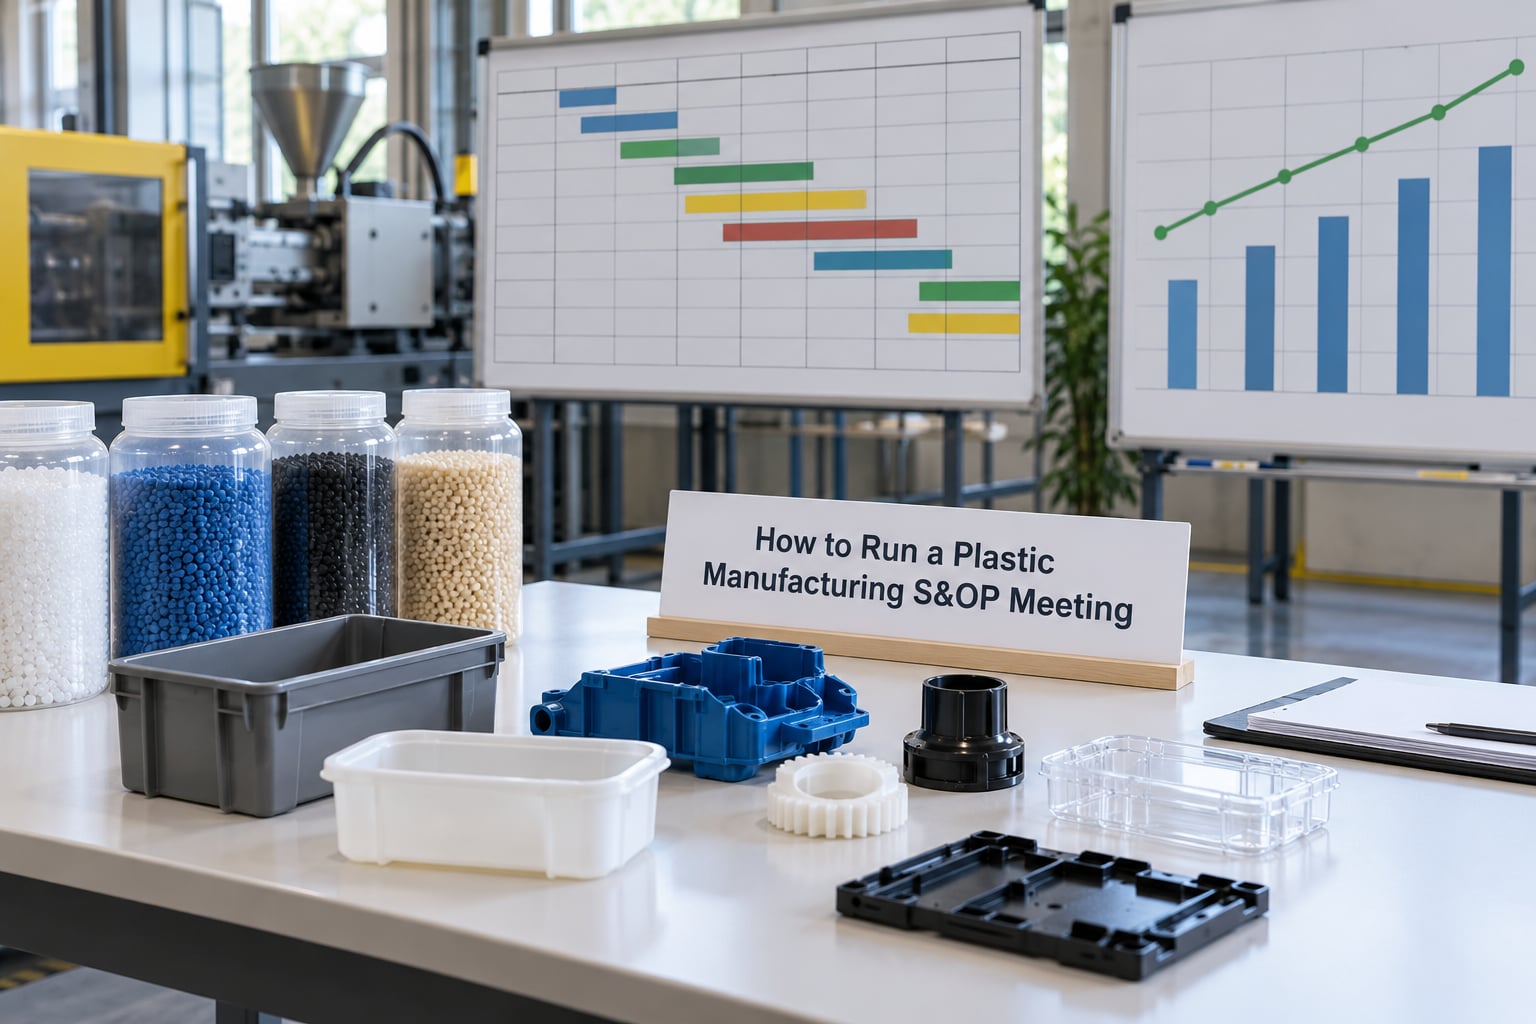
In plastics and packaging, the supply side of the balance sheet is unusually physical. Resin arrives in super sacks with a lead time measured in weeks and a price that moves on its own schedule. Tools, not machines, set the real ceiling: a customer with a unique cavity owns your capacity whether the press schedule likes it or not.
Build the plastics supply plan around those five constraints:
- Resin availability and grade. Confirm allocation and lead time for each resin before promising a volume, and record the substitute grade where a qualification already exists.
- Tooling ownership. Show tool availability as its own line in the plan, including maintenance windows and tools sitting in a customer’s name.
- Changeover cost and sequence. Group colour and tool changes deliberately; a plan that ignores changeover time always promises more hours than the plant has.
- Colour and quality holds. Inventory in quality hold is not available inventory, and colour-specific runs create obsolescence when the demand plan moves.
- Customer commitments. Contract packs and dated delivery windows outrank an unconfirmed forecast line, and the demand plan should reflect that priority rather than argue with it.
Packaging demand adds seasonality and campaign peaks that hit two to six weeks out. Treat campaign windows as a demand scenario in the monthly cycle and as an exception in the weekly one, because a shifted campaign date is a plan change, not a rounding error. Where returns and take-backs matter, the reverse logistics process for manufacturers feeds recovered volume back into the demand plan.
S&OP Metrics and KPIs
Track a small set of measures and review them in the same meeting every cycle. Ten metrics are enough; more than that and nobody owns any of them.
| Metric | What it tells you | Healthy direction |
|---|---|---|
| Forecast accuracy | How close the consensus forecast was to actual demand | Improving, by family |
| Forecast bias | Whether the plan runs consistently high or low | Near zero |
| OTIF delivery | Whether the plan reaches the customer intact | Improving |
| Inventory turns and days forward cover | Whether you are carrying stock or starving the pipeline | Within target band |
| Schedule attainment | Whether the plant can execute what supply planning promised | Over 95 percent |
| Premium freight and expedite spend | The visible cost of plan failure | Falling |
| Capacity utilisation | Whether capital is working or sitting idle | Steady, not spiky |
| Action-item closure | Whether the process is real or theatre | Over 85 percent closed on time |
| Obsolescence write-off | Whether surplus decisions are arriving late | Falling |
| Cost to serve | What the plan actually costs per order | Trending down |
Common S&OP Mistakes and Fixes
Running on monthly totals only. A total that balances across families tells you nothing about where to act. Fix: review at product-family level and let totals roll up automatically.
Treating the forecast as a sales quota. The moment the demand plan is a target, it stops being a prediction and every challenge becomes political. Fix: measure forecast accuracy as an accuracy exercise and keep bookings targets in a separate review.
Mixing strategic and operational decisions. A capital request for 2028 does not belong in a meeting that must settle next month’s overtime. Fix: run a separate quarterly strategic S&OP for the 18-to-36-month layer.
Leaving customer service out. Customer service sees early demand signals that never reach the forecast. Fix: give it a standing seat and a formal right to raise a challenge.
No named owner. Without one person responsible for the calendar, the pre-reads slip and the cycle quietly dies. Fix: appoint an S&OP manager with time budgeted for it.
Presenting live for two hours. Reading a 60-slide deck aloud is how a decision forum turns into a data review. Fix: pre-read plus a decision-only agenda.
Decisions without records. When the rationale is not written down, the same argument returns next month with a new name on it. Fix: a decision log with the option chosen, the options rejected, the owner and the date.
Letting actions age silently. An action list with 30 percent closure is the clearest sign the cycle is decorative. Fix: review aged actions in the weekly exception meeting.
Frequently Asked Questions
Who should own the sales and operations planning process?
One named person, usually a supply chain or operations manager, owns the cycle: the calendar, the pre-reads, the decision log and the action list. Functional leaders stay accountable for their own inputs, and a CEO, COO or CFO sponsors the executive meeting. Without that single owner, meetings drift and the cycle stops within two or three months.
How often should S and OP meetings be held?
The standard cadence is a monthly cycle with weekly preparation meetings. A first-time programme often starts quarterly and moves to monthly once the data is stable. The executive S and OP sits at the end of each cycle and normally runs 60 to 90 minutes. Weekly exception meetings handle new signals between cycles without disturbing the monthly plan.
What is the difference between S and OP and IBP?
S and OP balances demand, supply and finance on a rolling twelve-month window. Integrated Business Planning extends that logic further: it runs over a longer strategic horizon, adds a wider range of scenarios and resources, and typically involves board-level decisions on investment and portfolio. A company running a disciplined S and OP can grow into IBP, but IBP is not a prerequisite.
Who should attend the executive S and OP meeting?
Keep it small: the executive sponsor, the heads of sales, supply chain, operations and finance, and the S and OP manager presenting. The group decides between priced scenarios and resolves trade-offs, so attendance beyond roughly eight dilutes the decisions. Detail below product-family level belongs in the pre-S and OP pack and the minutes, not in the room.
How do you fix forecast bias in S and OP?
Bias usually comes from unchallenged optimism: sales assumes promotion, operations assumes overtime and marketing assumes share gain. Record every challenge with a named reason and a source, compare the consensus forecast to actuals each cycle, and report bias per product family. A plan that runs 15 percent low for four cycles has a process problem, not a reporting problem.
Does a small manufacturer need S and OP, or is it overkill?
If you have more than one product family, uneven lead times or a plant that cannot build every order on demand, the process earns its place quickly. The first cycle can be simple: one spreadsheet, one family, 90 minutes a month. What matters is the single agreed number and the recorded decision, not the sophistication of the tooling.
Conclusion: Start With One Product Family
The sales and operations planning process is worth starting small. Pick one product family with a real supply constraint, name an owner, and run a 90-minute monthly cycle for three months. End each one with a written decision, a named action and a comparison of plan against actuals. Three cycles of that is usually enough to see whether the business is making one plan or three, and 2026 is a fine time to start counting.