
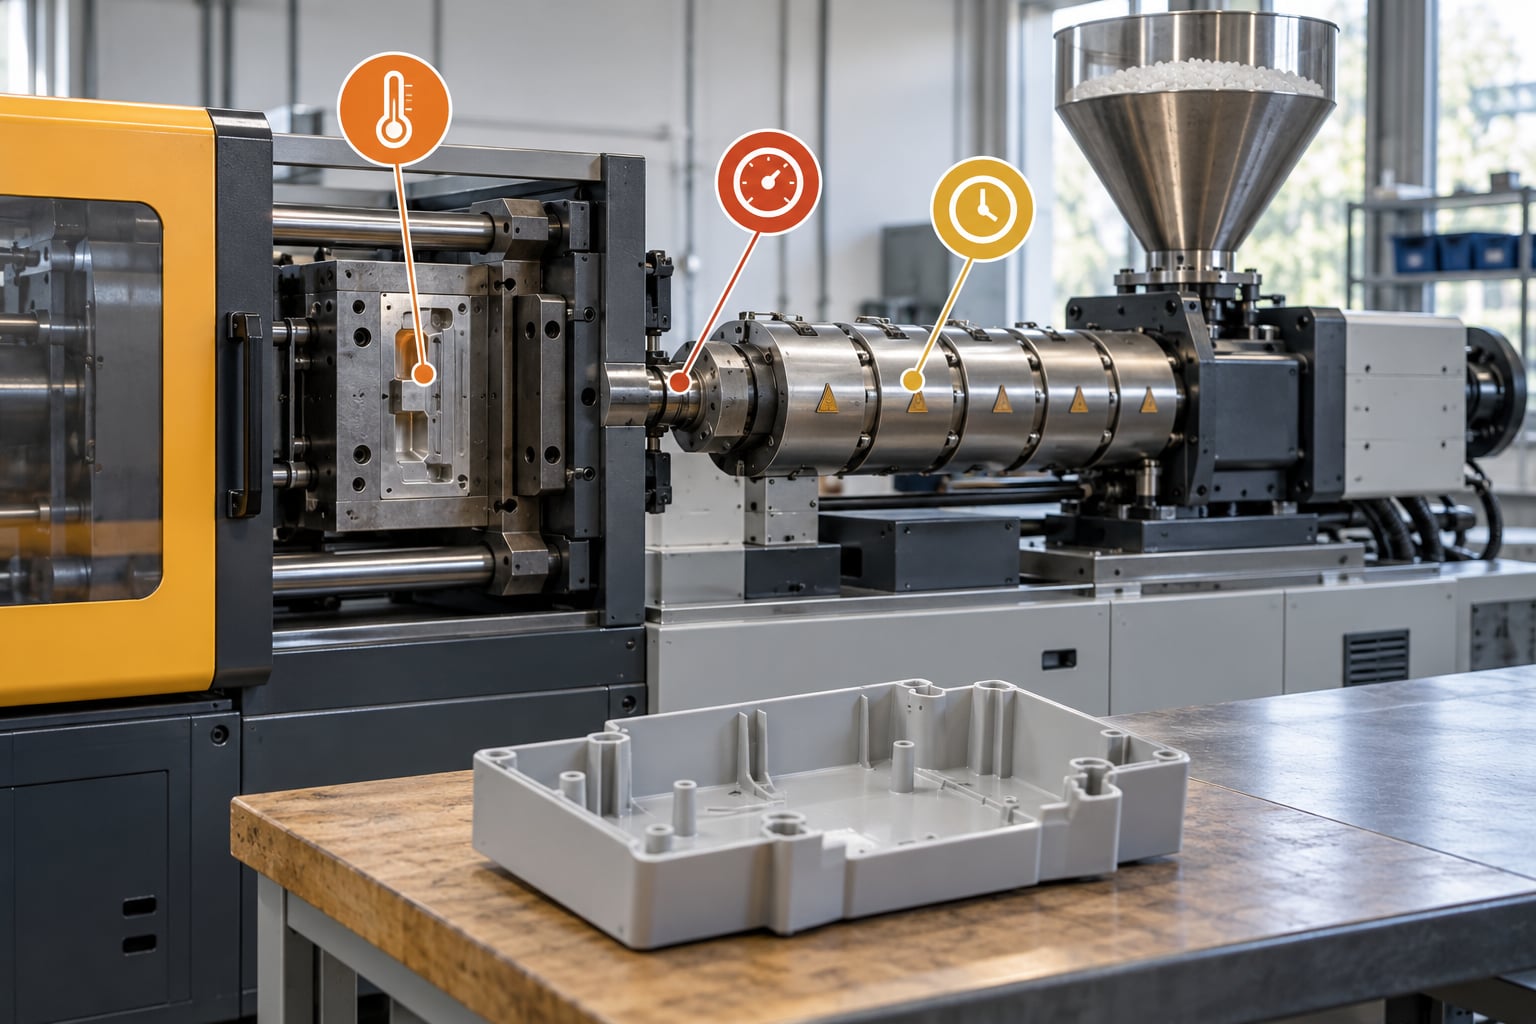
Scientific molding is a way of controlling injection molding by measuring what the plastic is actually doing, not by tweaking machine settings until the parts look acceptable. Instead of judging success by barrel zone readings and screw rpm, you work with fill time, melt temperature, peak cavity pressure, part weight and cooling time. Those process outputs describe the material, so they travel with the job from one press to the next.
That shift matters more than it first sounds. A setting recorded on a 100-ton press means little on a 300-ton press, but a 4.2 second fill and a 950 bar peak cavity pressure can be reproduced anywhere. This guide covers scientific molding explained as a working method: what it involves, which variables to control, how it reduces defects, and what it takes to put into practice.
Table of Contents
- What Is Scientific Molding?
- How Scientific Molding Differs from Traditional Trial and Error
- The Scientific Molding Process: From Hypothesis to Validated Process
- Which Process Variables Should a Molding Team Control?
- How Scientific Molding Controls Quality
- How Does Scientific Molding Reduce Defects?
- How Many Trials Are Needed to Validate a Scientific Molding Process?
- What Tools and Data Does Scientific Molding Require?
- When Should a Team Use Scientific Molding Instead of Adjusting Settings by Hand?
- Frequently Asked Questions
- Is scientific molding the same as DOE?
- What is the main difference between scientific molding and trial-and-error molding?
- Can scientific molding be used with existing injection molding machines?
- What measurements are usually needed to validate a molded part?
- How does a process window differ from a single set point?
- Which molding defects benefit most from a scientific molding approach?
- Conclusion: Start with One Measurable Process Problem
What Is Scientific Molding?
Scientific molding treats the molding machine as a tool that applies four variables to a polymer, then measures the results of those variables in plastic terms. The method was built around the idea of viewing the process from the plastics point of view, which means every process setting is translated into a measurable effect on the material itself.
Conventional molding starts from the machine. An operator sets the rear zone to a temperature, turns the screw to a speed, sets a hold pressure in bar and moves on. When parts flash, the natural response is to move a machine number. Scientific molding starts from the part instead. The question becomes what melt temperature, fill time and cavity pressure produce a full, weld-line-free, dimensionally stable part, and those answers survive a mold transfer.
The four variables behind every molded part
Everything a screw does to plastic comes down to four things. The mold industry has organized process control around these four variables since the 1980s, and most troubleshooting frameworks still start here.
- Heat — the thermal energy in the melt, expressed as melt temperature and mold temperature, which together set viscosity and cooling rate.
- Pressure — the forces driving the melt, including injection pressure, pack pressure and clamping force, which set fill and packing density.
- Flow — the rate at which melt moves, expressed as fill time and flow rate, which sets shear heating and how much of the tool fills before the material freezes.
- Cooling — the heat removed after filling, expressed as cooling time and mold temperature, which sets crystallinity, shrinkage and residual stress.
Change any one of them and the part changes with it. That is why controlling the four variables is enough to control a molded part, and why controlling them deliberately is the core of scientific molding explained in practice.
Where scientific molding fits among molding methods
Molding practice generally splits into three camps. Trial-and-error molding relies on the experience of the setter who happens to be at the press. Scientific injection molding uses experiments and measurements to establish a documented process. Process control molding sits closest to automated production, where closed-loop systems read sensors and adjust the machine inside tight limits on their own.
None of these are mutually exclusive. Many plants run trial-and-error during early tool commissioning and shift to a documented process before the tool moves to production. A quality system that demands IQ, OQ and PQ documentation effectively requires the second method, because a validation protocol cannot be built on remembered setpoints.
How Scientific Molding Differs from Traditional Trial and Error
Traditional trial and error and scientific molding both aim for good parts, but they reach the answer by different routes and leave behind different evidence. The table below compares them on the points that actually change daily results on the floor.
| Dimension | Trial-and-error molding | Scientific molding |
|---|---|---|
| Starting point | Machine settings | Measured process outputs |
| Method of change | Adjust a number, observe a part | Run a defined experiment, record the response |
| Record of success | Memory and tribal knowledge | Written setup sheet with target ranges |
| Repeatability | Setter dependent | Transferable between presses and shifts |
| Troubleshooting | Change settings, try again | Compare the process output to the target |
| Scrap on restart | Startup scrap until it runs right | Startup verification against a known good process |
| Machine dependency | High | Low |
| Audit readiness | Weak | Full traceability |
The practical difference shows up on the second shift. If the only record of a good process is what the first setter remembers, the second setter rebuilds it through trial and error and creates scrap doing it. With a documented process and defined output ranges, the second setter verifies against targets and confirms the process without guessing.
It also changes how troubleshooting works. With a cavity pressure trace stored for a good part, a defect becomes a comparison. A slow fill against the target points at melt temperature or a cold mold; a pressure peak that decays too fast points at hold pressure and hold time. Without the trace, every hypothesis is a guess.
The Scientific Molding Process: From Hypothesis to Validated Process
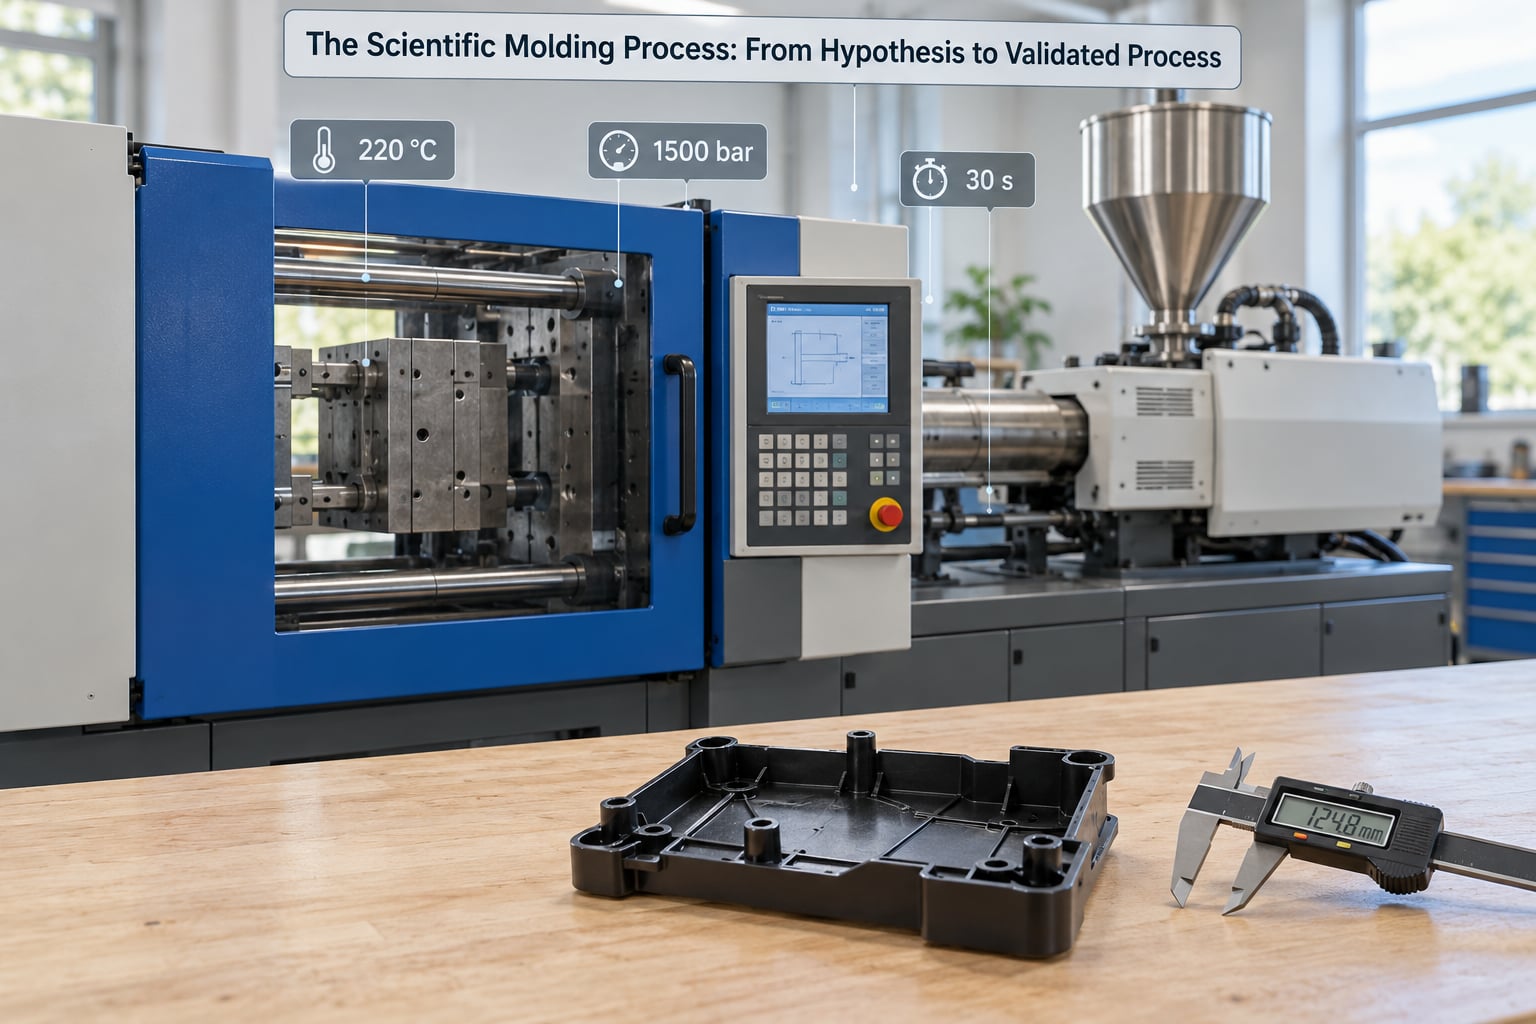
A scientific molding study runs as a sequence of roughly six stages, each one producing a documented result that the next stage depends on. Teams that skip a stage end up with a process that happens to work on one press.
- Define the problem. State the outcome you are chasing in measurable terms: a 0.05 mm dimensional band, a flash limit, a maximum allowable part weight, or a first-shot approval rate. If the problem is written as “parts look bad,” the study has nowhere to go.
- Map the process. Document the machine, tool, resin, dryer settings and current setup. Draw the flow path from runner to gate to end of fill, and note where pressure is lost. This map becomes the shared reference for everything after it.
- Select factors and levels. Pick the variables worth testing and the range for each. Typical candidates are melt temperature, mold temperature, fill time, hold pressure and hold time. Levels need enough separation to produce a measurable response.
- Run the experiments. Execute a designed matrix rather than a one-at-a-time sequence. A factorial or fractional factorial design shows interactions that sequential testing misses, and it does so in far fewer runs.
- Analyze and optimize. Fit the responses, look for the combination that meets every criterion at once, and shrink cycle time where the data allows. Reject combinations that pass dimensions but fail appearance.
- Confirm and document. Re-run the chosen combination from a cold machine as a confirmation study, verify capability with a capability study on Cp or Cpk, then write the setup sheet and hand it to production.
After the study, the process moves into formal validation under a quality system. Installation qualification confirms the equipment, mold and material are set up correctly. Operational qualification demonstrates the process performs across its intended range. Performance qualification confirms it holds up in normal production. The documented standard process, the setup sheet that states each process output with a target and a range, ties all three together.
Long-term studies add more. A short-shot study and a pressure-loss study on a new tool tell you how the material behaves before production starts. If the tool needs a change, a process window study maps the combinations that fill the part, which shortens the modification cycle considerably.
Which Process Variables Should a Molding Team Control?
A molding team controls two different kinds of variables. Process inputs are the machine settings you dial in. Process outputs are the measured effects on the plastic. Scientific molding deliberately documents the outputs, because those are the numbers that predict part quality.
| Variable | Type | What it affects |
|---|---|---|
| Resin drying (moisture, temperature, time) | Input | Viscosity and color; splay and bubbles when wet |
| Barrel zone temperatures | Input | Melt temperature delivered to the tool |
| Melt temperature | Output | Fill behavior, pressure loss, crystallinity |
| Mold temperature | Output | Cooling rate, shrinkage, warpage, cycle time |
| Screw speed | Input | Shear heating, recovery time, degradation risk |
| Fill time | Output | Flow rate, weld line strength, pressure profile |
| Hold pressure and hold time | Output | Part weight, voiding, flash, gate seal |
| Transfer position or transfer trigger | Input | When the machine switches from fill to pack |
| Cooling time | Output | Ejection temperature, distortion, cycle length |
| Cushion and recovery range | Output | Shot consistency from shot to shot |
| Clamp force | Input | Flash and parting line behavior |
| Cavity pressure | Output | Fill confirmation, packing effectiveness, density |
Cushion is worth explaining because it is the most often misused output. Cushion is the plastic volume left in front of the screw at the end of metering. Too small and the shot drops from cycle to cycle. Too large and you inject a slug of air-filled, partially melted material. Most plants target a stable cushion across the recovery range, and that number appears on the setup sheet because it is a plastic variable, not a machine one.
Transfer position is the classic example of a setting that hides a variable. Transfer on position means switching at a fixed screw position. Transfer on cavity pressure means switching when a transducer at a known cavity reaches a set pressure, which is machine independent and holds fill consistent as wear changes the tool.
How Scientific Molding Controls Quality
Quality control in scientific molding means comparing measured process outputs against documented targets, every shot or every lot, rather than inspecting parts at the end of a run and reacting. The documented process defines what good looks like in numbers, and the measurement system tells you whether the process is still producing it.
Three layers of data usually do the work. Cavity pressure traces confirm fill and pack, and a pressure drop means a leak, a short or a vent problem before anyone sees a defect. Part weight sampled at a defined frequency catches drift in shot size, hold and cushion long before dimensions move. Critical dimensions measured on a defined sampling plan catch the changes that matter to the customer, and statistical sampling plans explained for molders cover how often to measure without drowning in paperwork.
Those layers feed statistical process control. SPC charts for injection molding explained show why a control chart on part weight, fill time and peak cavity pressure will reveal a shift long before the tolerance limit. A chart on a single critical dimension is less useful, because normal measurement variation on molded parts is wide enough to mask a small shift.
The output of all this is a control plan that names the characteristic, the target, the range, the measurement method, the sampling frequency and the response when it drifts. A control plan that does not include a defined response is a log, not a control plan. When a characteristic moves outside its range, the response is written down before it happens, which is the difference between reacting and preventing.
Traceability closes the loop. Material lot, dryer time, tool number, cavity number, machine number, and the full cycle data attached to each lot let you answer a customer question about a part shipped three months ago. Plants running MES and QMS systems can hold this automatically; paper setups work, they just need discipline.
How Does Scientific Molding Reduce Defects?
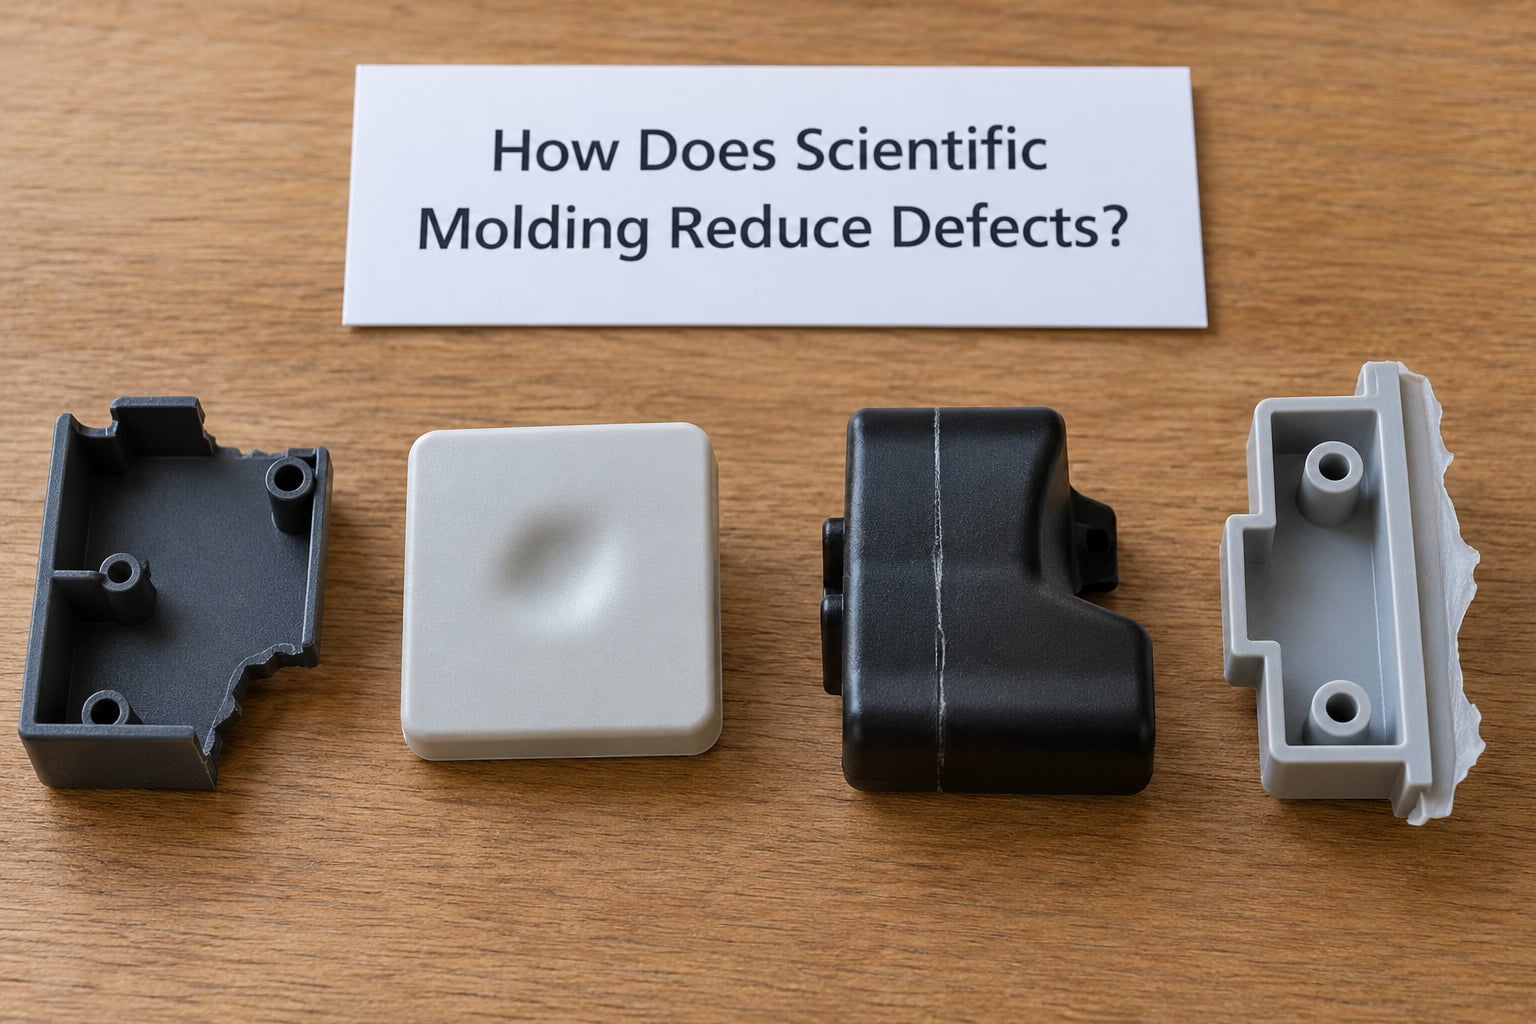
Scientific molding reduces defects because each defect has a physical signature in the process data. Once you have a cavity pressure trace and a fill time target, the defect tells you which variable moved, and a designed experiment confirms it in a handful of runs instead of a week of guesswork.
- Short shots — the mold only partially fills. Look at fill time, melt temperature and mold temperature. A long fill time against target usually means too little heat in the melt or a cold mold, so you raise one or both and re-measure. In a multicavity tool, compare cavity pressure per cavity; a single slow cavity points to flow imbalance or a blocked gate rather than a global setting.
- Weld lines — two flow fronts meet and fail to fuse. Weld line strength rises with melt temperature and fill time, so slowing the fill and adding heat strengthens it. Moving the gate or adding a runner overflow is the design-side answer when the process window cannot deliver enough.
- Warpage — uneven shrinkage across the part. Mold temperature is the dominant variable because uneven cooling creates uneven shrinkage. Raising the temperature on both halves, balancing flow so all cavities cool alike, and checking for uneven clamp force all address the cause.
- Sink marks — a thick section cools slower than the rest and pulls inward. Hold pressure and hold time determine how much material packs into the thick area. Extending hold until the gate seals, then confirming gate seal time in the cycle, is the standard fix.
- Flow marks — cosmetic streaks where the melt front splits around a feature. These respond to fill time and to where air is trapped. Slowing the fill, adjusting the vent, or verifying the tool vents only at the end of fill all help.
- Flash — material escapes at the parting line. Excess clamp force or excessive pack pressure both cause it, as does damage to a wear strip. Cavity pressure at the end of fill tells you whether you are overpacking or whether the tool is the problem.
The reason this works is that the variables interact. Hold time has no effect once the gate seals, so the useful experiment is hold time across levels where some shots gate seal and some do not. A designed matrix with gate seal time measured at each run turns a guessing loop into a single graph.
How Many Trials Are Needed to Validate a Scientific Molding Process?
There is no fixed number of trials, and anyone who gives you one is guessing for your part. The count follows from four things: how many factors you are testing, how much the process normally varies, how much capability you need to demonstrate, and which standard your customer or regulator requires.
A rough planning approach works. Start with a screening design covering four to six factors at two levels each. A full factorial on six factors needs 64 runs; a fractional factorial of the same resolution needs 8 to 16. Use the screening run to find which factors actually move the response, then drop the ones that do not.
From there, run a confirmation study of the chosen settings, usually three to five runs from a cold machine, because a process that works after a warm-up is a process you do not yet understand. For capability, most plants aim for Cpk of at least 1.33 on critical characteristics, which generally needs a sample of 100 or more consecutive good parts, collected after the process is stable.
So a realistic total for a new tool sits somewhere around 30 to 60 experimental runs, followed by a separate capability sample of 100 or more production parts. A well-characterized tool undergoing a small change needs far less. What never works is skipping the confirmation runs and treating the best screening combination as proven.
What Tools and Data Does Scientific Molding Require?
Scientific molding runs on equipment most plants already own, plus measurement capability that many have never bought. A modest but complete setup covers five areas.
Capable equipment. A press with repeatable injection control, closed-loop barrel and mold temperature control, and repeatable cushion recovery. Machine age is not disqualifying; repeatability is. A machine that cannot hold a set temperature within a degree will not hold a mold temperature study together.
Calibrated sensors. A cavity pressure transducer in at least one cavity, a pressure transducer or data acquisition for the injection side, a calibrated melt thermocouple near the nozzle tip, and thermocouples on both mold halves. A mold temperature controller with real-time display and logging.
Measurement tools. Calipers, a micrometer, a balance or automated part counter for weight, a tensile tester if mechanical properties are a criterion, and a microscope or visual defect standard so appearance defects are described consistently instead of interpreted differently by each shift.
Material records. Resin grade, lot number, moisture content and the dryer temperature and dwell time used. A rheology curve for the resin, from the supplier’s technical data sheet or your own capillary rheometer run, tells you the viscosity behavior you are working against.
Analysis tools. Spreadsheet capability or dedicated DOE software for building matrices and fitting responses, and a statistical process control package for control charts and capability indices. The math is not exotic, and the discipline matters far more than the software.
One thing worth budgeting for is training. Most implementation failures are not equipment failures. A plant that has cavity transducers nobody knows how to read, or DOE results nobody knows how to interpret, owns expensive paper.
When Should a Team Use Scientific Molding Instead of Adjusting Settings by Hand?
Scientific molding pays for itself when the cost of variation is high or the process is about to get more complicated. Six situations come up repeatedly.
Inconsistent parts on an otherwise capable tool. If the process works on shift A and drifts on shift B, the machine is not the variable that changed. Someone’s judgment is, and that is exactly what a documented standard process replaces.
A new material or a new supplier. Different resin lots change viscosity, shrinkage and cooling behavior. Rather than re-learning the tool by feel, run a screening study and re-establish the output targets in a day.
Molds moving between machines or sites. Portability is the clearest argument for the method. When a documented process specifies fill time, peak cavity pressure, hold pressure and part weight, the second press is brought to those numbers rather than approximated by matching machine settings. The same setup sheet also cuts changeover time on molding presses, because the setter is verifying outputs instead of rebuilding the process from scratch.
High-volume production. A defect rate that is small but applied across millions of parts is expensive, and statistical process control with defined alarm parameters catches drift long before the customer does.
Regulated or customer-controlled work. Medical devices, food contact and automotive tier-one work all come with documentation requirements. ISO 13485 and FDA quality systems expect validated processes, which in practice means measured process outputs rather than remembered settings.
Difficult tools. Long fill times, thin walls, high shrink resins and multicavity tools with balance problems all take far longer to tune by feel than with a designed experiment.
For a single low-volume part with a tolerant print, hand tuning is probably fine. The method earns its cost when variation is expensive.
Frequently Asked Questions
Is scientific molding the same as DOE?
No, though they are used together. Design of experiments is the statistical method for planning and analyzing runs, and it is used in areas far beyond molding, including metal forming and chemical processing. Scientific molding is a molding-specific framework: it defines which variables matter, insists they be measured from the plastics point of view, and requires the result to be documented so the process can be verified and transferred. DOE without that framework produces data; scientific molding with it produces a controlled process.
What is the main difference between scientific molding and trial-and-error molding?
Trial-and-error molding adjusts machine settings and judges the result by looking at parts, leaving the knowledge with the person who ran it. Scientific molding changes one variable at a time through planned experiments, measures process outputs such as fill time, melt temperature and part weight, and records targets and ranges in a setup sheet. The result transfers between presses, survives a setter change, and supports formal validation.
Can scientific molding be used with existing injection molding machines?
Yes, and most implementations start on existing equipment. What matters is repeatability: the machine must hold barrel and mold temperatures, reproduce cushion, and deliver the same fill time shot after shot. A hydraulic press from twenty years ago can often meet that after a control and thermocouple upgrade. What you cannot skip is measurement, because without a cavity pressure transducer and a way to log cycle data you have no process outputs to control.
What measurements are usually needed to validate a molded part?
A practical set covers four areas. Process outputs: melt temperature, fill time, peak cavity pressure, hold pressure profile, cushion and cooling time. Part characteristics: weight, critical dimensions, and mechanical properties where they matter. Appearance: flash, sink marks, weld line visibility, flow marks and short shots, judged against a written visual standard. And traceability data, including material lot, dryer time, tool and cavity number, attached to each production lot.
How does a process window differ from a single set point?
A single set point is one combination of settings, and it sits somewhere in the middle of everything the process can tolerate. A process window is the area where part quality holds up: a range of melt temperature, fill time, hold pressure and cooling time combinations that all produce conforming parts. The window tells you how much margin you have, which determines whether a small resin lot difference or a worn cavity will cause a problem. Run a process window study to map it.
Which molding defects benefit most from a scientific molding approach?
The ones with a clear physical signature in process data do best. Short shots, flash, sink marks, weld lines, flow marks and warpage all respond to specific variables such as fill time, hold pressure, hold time and mold temperature. A cavity pressure trace usually points to the cause before the part does. Cosmetic defects on tight-tolerance cosmetic parts also improve quickly, because appearance criteria get written down instead of interpreted differently by each shift.
Conclusion: Start with One Measurable Process Problem
Pick one defect or one critical dimension, write down the target it must hit, and identify the two or three variables most likely to move it. Fit a cavity pressure transducer, run a small designed experiment, and write the result into a setup sheet with a target and a range for every process output.
That single cycle is where scientific molding explained becomes a habit rather than a concept. Once the plant has one documented, transferable process, the same method applies to the next tool without any new argument about why.