

How to reduce manufacturing costs comes down to one habit: know your true unit cost before you change anything, then attack the biggest cost bucket first and measure the result. The savings come out of material yield, labor minutes, machine uptime, energy per part, and overhead, not out of cutting people or blaming suppliers.
Lean programs are widely reported to shave 5% to 20% off production cost in the first year by removing waste and limiting overproduction, and that range is a reasonable expectation for a plant that starts with accurate data. Most failed cost programs fail for the same reason: they begin with a percentage target, not with a cost baseline.
The nine steps below run in order. Each one names what to do, what data to collect, and how you can tell it worked.
Table of Contents
- What You Need
- How to Reduce Manufacturing Costs: Step-by-Step
- 1. How to Reduce Manufacturing Costs: Establish a Baseline
- 2. Reduce Material Cost Without Sacrificing Quality
- 3. Improve Labor Productivity and Cell Balance
- 4. Cut Machine Downtime and Changeover Time
- 5. Reduce Energy and Utility Consumption
- 6. Lower Inventory, Packaging, and Supply Chain Costs
- 7. Reduce Defects, Rework, Warranty, and Scrap Costs
- 8. Control Overhead and Indirect Costs
- 9. Verify Savings and Prevent Cost Shifting
- Common Mistakes
- Frequently Asked Questions
- What is the fastest way to reduce manufacturing costs?
- How do you calculate the manufacturing cost of a product?
- Does reducing manufacturing costs require replacing equipment?
- How can a factory reduce material waste and scrap?
- How do you know that a cost-reduction project actually saved money?
- Should manufacturing cost reduction be handled by production, purchasing, or engineering?
- Conclusion
What You Need
You cannot reduce manufacturing costs you have never calculated. Before the first change, gather the following, and give every cost driver an owner and a target number.
- A cost-per-unit breakdown. Direct materials, direct labor, and manufacturing overhead, separated into variable and fixed.
- Scrap and rework data for the last six months. By part number, by cause, and by shift where the data allows.
- Downtime and changeover records. Unplanned stops, planned stops, and setup minutes per job.
- Energy usage. Meter-level kilowatt-hours per shift, and per unit where submetering exists.
- Labor data. Direct hours per unit by product family, plus overtime and indirect labor lines.
- Purchasing records. Spend by supplier, price per pound or per unit, lead times, and minimum order quantities.
- Process documentation. Routing sheets, work instructions, and current control plans that people actually follow.
- Inventory data. On-hand by location, average dwell time, and slow-moving stock.
Two accounts managers on manufacturing forums keep making the same point from opposite ends: quotes on small runs go wrong because setup and overhead get buried or over-allocated, and cost of poor quality stays invisible because rework and scrap are never their own line item. Both problems are measurement failures, and both inflate the number you are trying to cut.
How to Reduce Manufacturing Costs: Step-by-Step
Work through these in sequence. Each step produces a measured result that funds and validates the next one, and every saving claim traces back to the baseline from Step 1.
1. How to Reduce Manufacturing Costs: Establish a Baseline
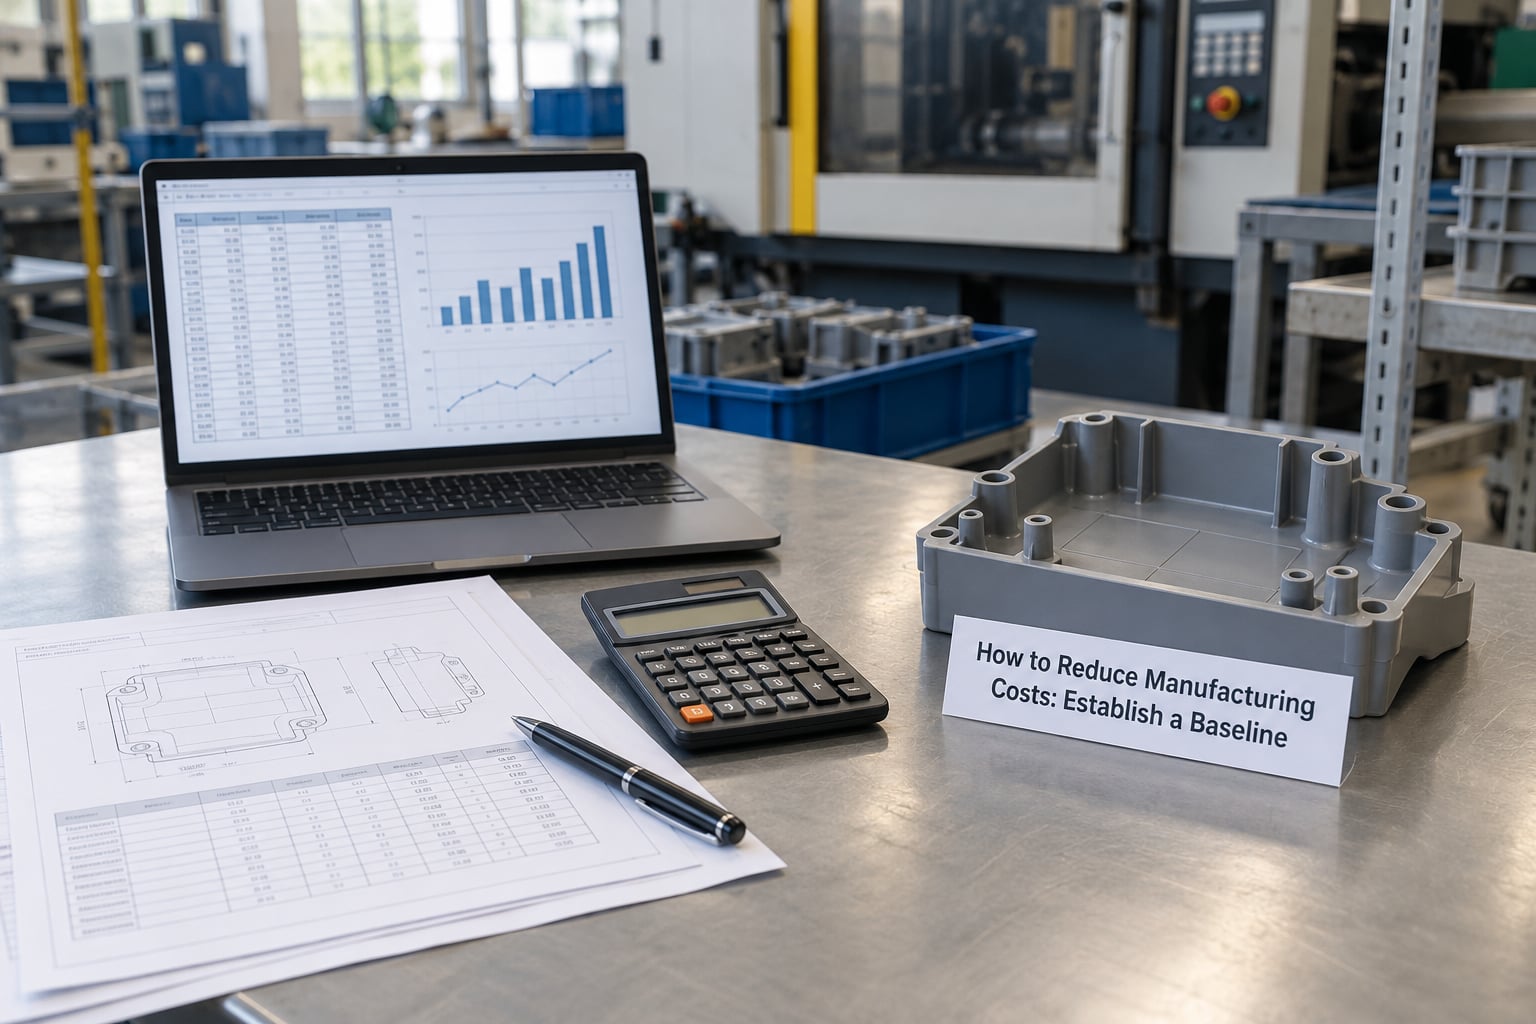
The baseline is the single most useful thing a cost program produces, and the diagnostic that separates good plants from struggling ones is cost per good part rather than cost per unit.
Cost per unit divides total spend by units started. Cost per good part divides it by units that actually shipped. On a line running a 6% scrap rate, those two numbers sit about 6% apart, and the gap is the money being destroyed on the floor. Suppliers quote per unit, customers pay per good part, and your margin lives in the difference.
Build the baseline in four parts: direct material at landed cost including freight and duties, direct labor at a fully loaded rate including payroll taxes and benefits, overhead allocated on a driver that actually drives it such as machine hours rather than labor hours, and quality cost including scrap, rework, and warranty returns.
| Cost category | Typical share of total cost | What drives it |
|---|---|---|
| Direct materials | Roughly 40% to 60% | Resin or component price, yield, scrap rate, freight, duty |
| Direct labor | Roughly 10% to 20% | Cycle time, staffing ratio, overtime, indirect labor load |
| Manufacturing overhead | Roughly 20% to 30% | Supervision, maintenance, quality, facilities, depreciation, energy |
Pick the largest bucket, name an owner, and set a numeric target with a date. Then write the baseline down, because six weeks from now you will not remember what the number was.
2. Reduce Material Cost Without Sacrificing Quality
Material is the biggest line and the least questioned, so this is where the largest savings usually sit.
Improve material yield first. Better nesting and layout, tighter purge and trim settings, and reuse of in-process regrind within the material’s own limits all raise the number of good parts per pound without buying a single machine. Standardizing parts across the product line shrinks the number of distinct materials you buy, which raises volume per SKU and improves your negotiating position.
Then look at the design. Design for manufacturability, and review tolerance stacking with engineering: a stack of tight tolerances across a part can be the single largest cost driver on a high-volume item, and relaxing one feature may be cheaper than any process improvement. Quoting the same point, buyers evaluating supplier quotes on cost per good part alone end up comparing the wrong number, which is worth knowing before you evaluate manufacturing quotes fairly.
Finally, attack purchasing. Change the minimum order quantity strategy, consolidate spend with fewer suppliers, buy direct from the mill where the volume supports it, and use payment terms as a lever. Suppliers report that consolidation frequently beats hard negotiation, and small operations on forums describe a better outcome from structural changes such as MOQ tiering than from annual price fights.
Cautions: do not change material grade without checking performance, food contact, regulatory, and customer requirements, and treat any supplier switch as a trial with defined acceptance criteria rather than a decision made in one meeting.
3. Improve Labor Productivity and Cell Balance
Measure labor content by product family before changing staffing, because a plant-wide average hides everything interesting.
Watch one operator for an hour and you will find the same six things: reaching over a stack, walking to fetch a tote, waiting for a machine, searching for a tool, doing a two-handed task one-handed, and re-checking something already checked. Each of these is cheap to fix once it is written down.
Then balance the line. Right-size equipment and operator counts per takt, combine steps so one part does not travel backward, standardize the work, and cross-train so a single absence does not stop a cell. Cutting motion is nearly always cheaper than cutting a person, and it is the step most often skipped.
Hold the line on training before headcount. A documented, taught, and audited standard method produces more than a faster operator working from memory, and a team that can run a new part quickly is worth more than the hours you saved on the old one.
4. Cut Machine Downtime and Changeover Time
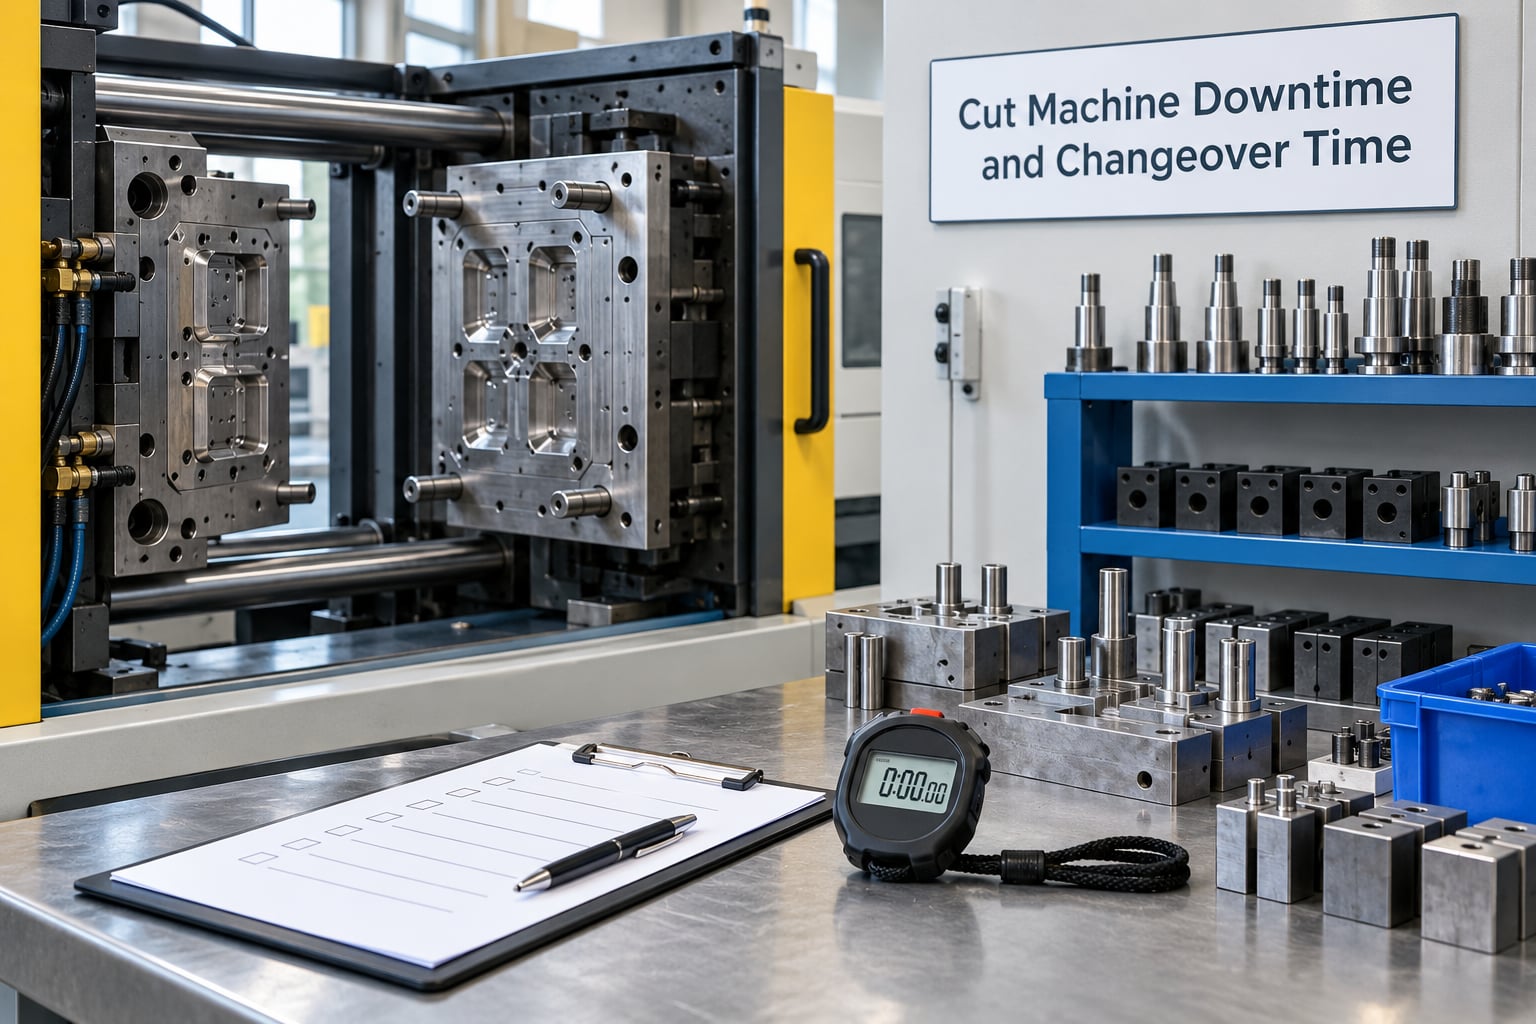
Downtime and changeover are the same money seen from two sides: capacity you own but cannot use.
Split the loss into planned and unplanned. Unplanned stops go to preventive and predictive maintenance, where a documented schedule, spare parts on hand, and condition monitoring on the highest-failure assets usually recover the most. Planned stops go to changeover reduction: film the setup into internal and external work, move as much as possible to the outside while the machine is still running, standardize tooling locations, and use quick-release clamps and pre-staged material and carts.
Our guide to reducing changeover time on molding presses goes deeper on the SMED sequence for a single machine type.
Verify the saving honestly. Time the changeover from the same start and end points, run enough cycles to average out material temperature and operator familiarity, and check the first twenty lots after the change for new defects. A faster changeover that produces a worse first article has saved nothing.
5. Reduce Energy and Utility Consumption
Energy is one of the easiest cost lines to measure and the easiest to improve, because the waste is usually visible and physical.
Start by finding where it goes. Submeter the big loads: presses, compressors, chillers, furnaces, and welding stations. Compressed air is the classic offender, since a single leaking orifice can cost real money per year, and running a compressor unloaded overnight is pure loss. Fix leaks, lower system pressure to the minimum your equipment needs, and install proper drain and control arrangements.
Then set targets per unit rather than per month, such as kilowatt-hours per thousand good parts, so a shift that runs faster at lower yield cannot look like a win. Insulate hot surfaces and piping, shut down or standby equipment that idles overnight, switch lighting to LED, and schedule energy-intensive runs off-peak where your utility tariff rewards it. Check whether your compressed air, power, or gas contract is structured so that demand charges, not consumption, are your biggest line.
One trade-off worth naming: running a line at maximum speed to protect a delivery date raises energy per unit and the defect rate at the same time. If energy per unit climbs when throughput spikes, you have found a throughput-versus-quality problem, not an energy problem.
6. Lower Inventory, Packaging, and Supply Chain Costs
Inventory is cash sitting on a shelf earning nothing and aging quietly, and carrying cost is made of storage, insurance, financing, and obsolescence.
Review safety stock item by item using actual demand variability and actual lead-time variability, not a blanket rule. Set reorder points from data, reduce order quantities where supplier minimums allow, and consolidate suppliers where the second source was never really used. Just-in-time gets a reputation for fragility, but the failures come from oversized batch sizes and unreliable lead times rather than from the concept itself.
Look at packaging and logistics next. Right-size cartons to the parts, eliminate unnecessary layers, standardize pallet and carton footprints so trucks fill properly, and consolidate shipments across orders and destinations. A carton that fits a part snugly is cheaper than one with a foam insert you added for a cosmetic reason.
Watch for hidden cost shifts here. Cutting safety stock raises expedite freight and overtime, and shortening lead times on paper without supplier agreement just moves the risk to the receiving dock.
7. Reduce Defects, Rework, Warranty, and Scrap Costs
Cost of poor quality is the largest cost most plants never see, because scrap, rework, and warranty returns rarely appear as their own line.
Track them as one number. Take the scrap value, the rework labor hours converted at your loaded rate, plus the material and freight for replacements, and add the cost of returns and credits. That total, expressed per unit shipped, is the number that makes quality arguments land with a finance team.
Reduce it with root cause analysis on the top three defects by cost, not by count. Then error-proof the specific step where each one is created: a fixture that cannot be loaded backwards, a sensor that refuses the cycle, a gauge that will not measure the feature in process. The eight wastes framework gives you the vocabulary for the rest of the non-value-added time, and a plant that has mapped its defects has usually mapped much of it already.
Measure with first-pass yield, rework hours per unit, and scrap rate by cause. Improvement here feeds every other step, since good parts need less material, less machine time, and less inspection.
8. Control Overhead and Indirect Costs
Overhead covers supervision, maintenance, quality, engineering, facilities, administration, depreciation, and utilities, and it behaves differently from the other two buckets because most of it is fixed in the short term.
Fix the allocation first. Overhead applied on a driver that does not drive it makes high-volume products look profitable and low-volume custom work look like a loss, which quietly kills the quoting for exactly the jobs you want. Activity-based costing is the honest version: pool the costs, find the real cost drivers, and set allocation rates from measured activity. Review the pools and rates at least annually, and more often if your mix shifts.
Then review the activities themselves with an owner and a number attached. Space utilization, spare parts inventory, software licenses, contractor hours, and travel all reward a review. Most overhead reduction is not layoffs; it is eliminating the supervision layer above a team that no longer needs it, or removing space nobody uses because the lease is the same either way.
Be careful with investments that claim overhead savings. An energy or automation project that does not clear a payback you defined in advance is a capital decision, not a cost reduction.
9. Verify Savings and Prevent Cost Shifting
A cost program that is not measured is a cost program that has not happened. This step is where the nine-step sequence either becomes a habit or a one-off project.
Confirm the savings three ways. The financial check: did spend actually fall, and is it in the right account? The operational check: did yield, cycle time, or downtime move by the amount you predicted? The customer check: did on-time delivery, returns, and complaints hold steady or improve?
Cost shifting is the failure mode to watch. A lower scrap rate that raises inspection labor, a smaller batch size that raises setup hours, or an inventory reduction that raises expediting costs is the same cost in a different column. Look for those second-order effects deliberately, because they usually appear in the month after the change lands.
Review results at 30, 60, and 90 days, then refresh your standard costs and put the successful change into the standard work. A setup reduction that lives only in one operator’s head reverts the first time that person is on vacation, so write it into the standard work and audit it.
Common Mistakes
These are the errors that turn cost reduction into a worse year than the one before.
- Cutting across the board by percentage. A flat 10% on every department lands hardest on quality, maintenance, and training, which are the three that protect everything else.
- Going after headcount first. Diagnostic work on spend, assets, and process removes far more money with far less damage, and it is what the evidence from working plants supports.
- Changing several variables at once. Cut the batch size and the safety stock and add a second supplier in the same month, and no one will know what worked. Change one driver, hold the rest, record the result.
- Double-counting savings. Scrap reduction and labor reduction frequently claim the same dollars. Assign each saving to one bucket and let the finance review arbitrate.
- Switching supplier on unit price alone. Cheaper material with longer lead times, higher rejection, or worse freight raises total cost. Compare landed cost per good part.
- Ignoring total cost. Unit cost alone misses carrying cost, expedite freight, inspection, and warranty. Total cost of ownership is the only number that survives a finance review.
- Treating cost programs as cyclical. A program that appears when revenue drops and vanishes when it returns never compounds. Structural savings survive a downturn.
The short list of what never to cut: quality systems, training, safety, and preventive maintenance. All four look expensive on a line item, and all four prevent losses that are larger and less visible than what they cost.
Frequently Asked Questions
What is the fastest way to reduce manufacturing costs?
Usually scrap and material yield. Material is roughly 40% to 60% of total cost, so a 3-point improvement in yield often beats a large labor project and lands in weeks rather than months. Start by weighing scrap for two weeks by part number and cause, then fix the top two causes with better nesting, tighter trim settings, and standard regrind use. Report results as cost per good part so the saving shows up in the number finance cares about.
How do you calculate the manufacturing cost of a product?
Add four things: direct materials at landed cost including freight and duty, direct labor at a fully loaded rate including payroll taxes and benefits, overhead allocated on a driver that actually drives it such as machine hours, and cost of poor quality including scrap, rework, and warranty. Divide by units shipped for cost per good part, or by units started for cost per unit. The gap between the two numbers is your scrap cost made visible.
Does reducing manufacturing costs require replacing equipment?
No, and it is usually the wrong first move. Most plants find their largest opportunities in setup time, unplanned downtime, energy at idle, safety stock, and overhead allocation, all of which need analysis and discipline rather than capital. Replace equipment when a documented gap exists: when a machine’s downtime or scrap rate is structurally beyond process improvement, or when labor content per part exceeds what the cycle time can support. Define the payback before you spend.
How can a factory reduce material waste and scrap?
Measure first: weigh scrap by part number and cause, then separate defects from normal trim and purge losses. Improve nesting and layout, tighten trim and purge settings, reuse in-process regrind within material limits, and standardize parts across the product line to reduce distinct material SKUs. Engage engineering on tolerance stacking and design for manufacturability, since a stack of tight tolerances is often the real cost driver. Reweigh scrap at 30 days and compare per unit shipped.
How do you know that a cost-reduction project actually saved money?
Check three things: did the spend actually fall in the account you expected, did the operational driver move by roughly the predicted amount, and did quality, delivery, and complaint rates hold or improve. Review at 30, 60, and 90 days, because cost shifting shows up late. A lower scrap rate that adds inspection labor, or a smaller batch that adds setup hours, is the same cost in another column. Assign every saving to one bucket so nobody counts it twice.
Should manufacturing cost reduction be handled by production, purchasing, or engineering?
It cannot be owned by one function. Production owns yield, cycle time, downtime, and changeover; purchasing owns price, lead time, and supplier structure; engineering owns design, part standardization, and tolerance; finance owns the baseline, allocation, and verification. Give each cost driver one named owner and one target, but run the program as a team with a shared baseline, otherwise each function optimizes its own column and the total cost barely moves.
Conclusion
Your first action is small: spend one week building a cost-per-good-part baseline for your top three products, including scrap, rework, and a fully loaded labor rate. Then attack the largest cost bucket with the largest measured gap, one change at a time, and review the result at 30 days.
How to reduce manufacturing costs is a measured improvement program, not an annual event. Plants that write the baseline down, keep one owner per cost driver, and check the numbers at 30, 60, and 90 days keep the savings when the cycle turns. Those that set a percentage target without measuring anything give it back within a year.