
If you run a plant and want a short, defensible list, track twelve numbers: OEE, schedule adherence, first pass yield, scrap and rework rate, cycle time against takt, changeover time, unplanned downtime, preventive maintenance compliance, on-time delivery, inventory accuracy and turns, safety performance, and cost per good unit. Together they cover production, quality, maintenance, supply chain, safety and cost, which is what stops a plant from optimizing output while quality and delivery quietly slide.
A manufacturing KPI is a quantified measure of how a plant performs against a goal, reviewed on a fixed cadence by a named owner. That last part is the part most scorecards skip: a number on a dashboard with no owner and no meeting never turns into a change.
Below, each metric gets a plain definition, the formula, a worked example with real numbers, a commonly cited target range, and what to do when it moves. The benchmarks are widely used industry ranges rather than universal truths, so treat them as a starting point for your own baseline.
Table of Contents
- Manufacturing KPIs Every Plant Should Track at a Glance
- 1. Overall Equipment Effectiveness (OEE)
- 2. Schedule Adherence
- 3. First Pass Yield
- 4. Scrap and Rework Rate
- 5. Cycle Time and Takt Time
- 6. Changeover Time
- 7. Unplanned Downtime
- 8. Preventive Maintenance Compliance
- 9. On-Time Delivery and Order Fill Rate
- 10. Inventory Accuracy and Inventory Turns
- 11. Safety Performance
- 12. Manufacturing Cost per Good Unit
- Frequently Asked Questions
- What are the most important manufacturing KPIs for a plant?
- How many KPIs should a manufacturing plant track?
- What is the difference between OEE and overall equipment effectiveness?
- Should a plant track only KPIs or also operational metrics?
- How often should manufacturing KPIs be reviewed?
- How do you choose KPI targets for a new plant or production line?
- Conclusion: Start With a Small, Balanced KPI Set
Manufacturing KPIs Every Plant Should Track at a Glance
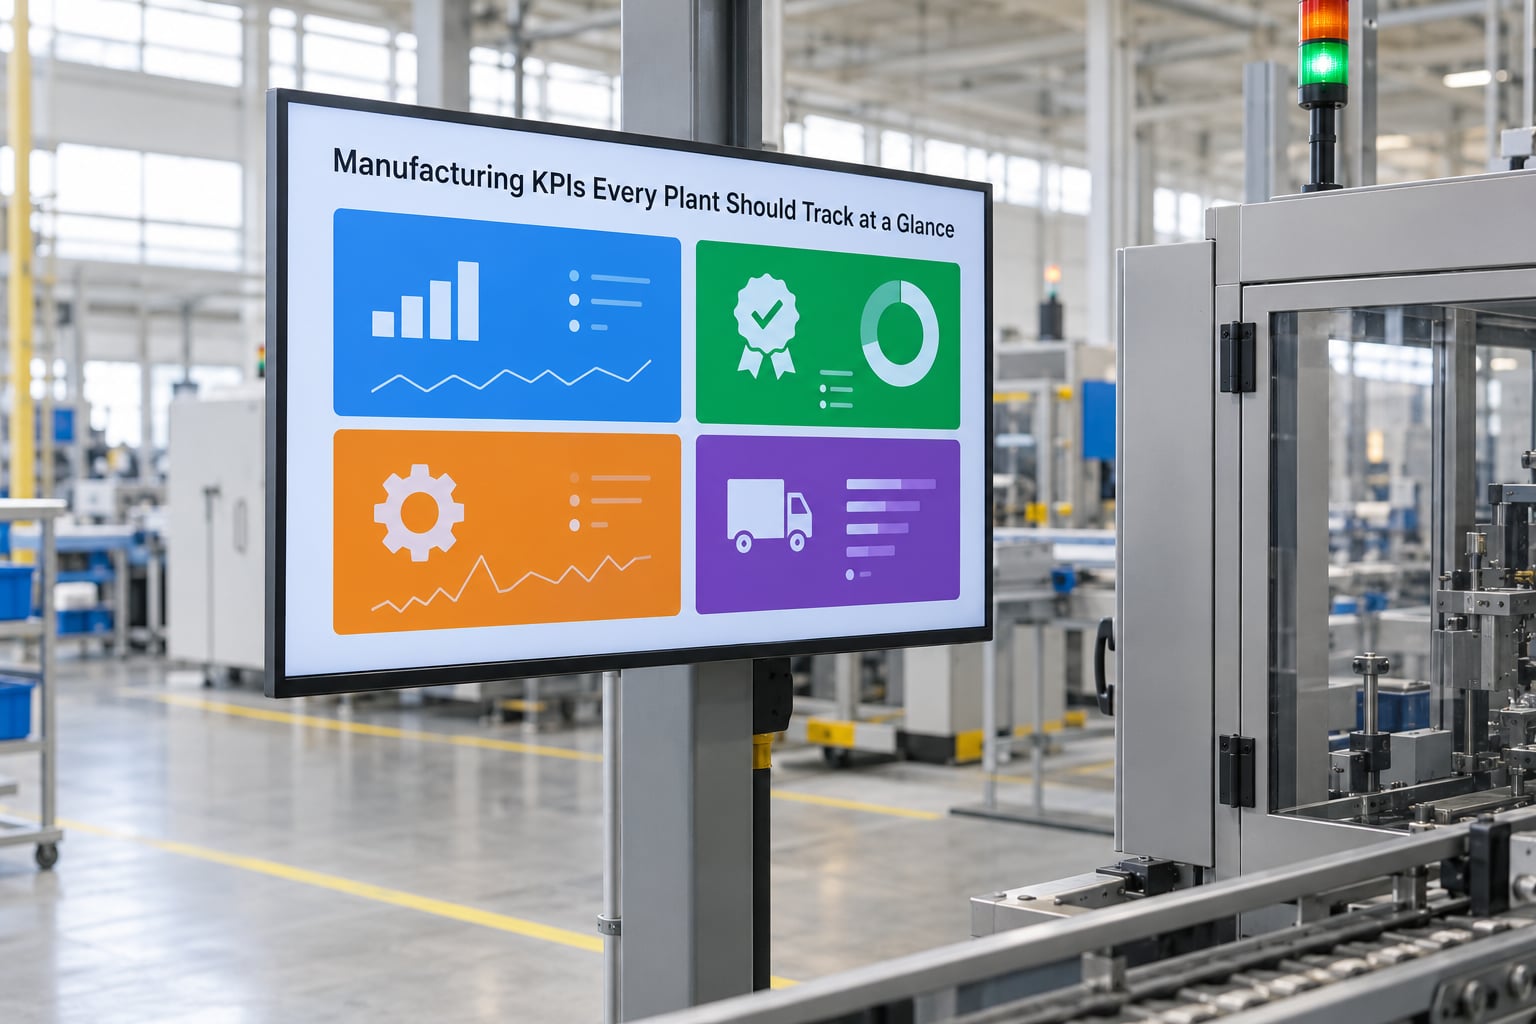
This table is the whole framework on one page. Read the last column first: every metric is only worth tracking because it answers a specific question a plant leader actually needs answered.
| KPI | What it measures | Main owner | Question it answers |
|---|---|---|---|
| Overall Equipment Effectiveness | How well a machine converts planned time into good output | Production manager | Where is capacity being lost? |
| Schedule adherence | Completed output against the planned schedule | Production planner | Can we promise dates? |
| First pass yield | Parts right the first time, without rework | Quality manager | Is the process stable? |
| Scrap and rework rate | Material and labour lost to defects | Quality manager | What do defects cost us? |
| Cycle time vs takt time | Actual production pace against customer demand pace | Industrial engineer | Are we faster or slower than demand? |
| Changeover time | Time lost switching between products | Line supervisor | Is setup eating our capacity? |
| Unplanned downtime | Unexpected stoppages and their causes | Maintenance lead | Which failures to fix first? |
| PM compliance | Planned maintenance tasks completed on time | Maintenance lead | Is preventive work actually happening? |
| On-time delivery / fill rate | Customer orders shipped complete and on time | Customer service lead | Are we keeping our promises? |
| Inventory accuracy and turns | Record vs physical stock, and stock movement rate | Materials manager | Is our cash sitting on the shelf? |
| Safety performance | Near misses, recordable cases, days without injury | Plant manager | Are we catching hazards early? |
| Cost per good unit | Total cost of producing one acceptable unit | Plant manager with finance | Are we profitable on what we ship? |
A small plant can start with five of these — OEE, first pass yield, schedule adherence, unplanned downtime and on-time delivery — and add the rest once the data collection holds up for a full quarter.
1. Overall Equipment Effectiveness (OEE)
OEE measures how effectively a machine or line turns scheduled time into good output. It multiplies three components: availability, performance rate and quality rate. A world-class OEE is commonly cited at 85 percent or above; a typical plant sits somewhere in the 60s and 70s.
The formula is OEE = Availability x Performance x Quality rate. On a molding cell running an eight-hour shift: 450 minutes of planned production, 63 minutes of stoppages gives availability of 86 percent. An ideal cycle time of 30 seconds against an actual 35 seconds gives performance of 86 percent. 480 good parts out of 500 produced gives quality of 96 percent. Multiply those and you get OEE of about 71 percent.
That single number tells you nothing on its own. Its value is in the split: availability problems point at reliability, performance problems point at speed losses, quality problems point at the process. If you want the full improvement path, how to improve OEE in a molding plant in eight steps walks through the diagnosis sequence.
2. Schedule Adherence
Schedule adherence compares completed production against the planned schedule, and it answers a different question from throughput. Output can hit the day target while the wrong part runs in the wrong hour, which is exactly how a late order happens.
Compute it as completed production in window / planned production in window. A line scheduled for 1,000 units in a shift and finishing 900 completed units lands at 90 percent. Most plants set a target between 90 and 98 percent.
When the number misses, look at the reason code rather than the total. Misses caused by machine failure go to maintenance, misses caused by late material go to purchasing, and misses caused by setup overruns go to the line. Treating all three as a scheduling problem is how schedule adherence stays low for years.
3. First Pass Yield
First pass yield, or FPY, measures the share of units that come off the line correct with no rework, inspection or repair. It is a leading measure of process health, which is why it beats final yield for improvement work. Final yield lets rework hide a bad process until the scrap bin tells you.
The formula is units passing first time / units produced x 100. A run of 2,000 units with 120 reworked or scrapped gives FPY of 94 percent. Commonly cited targets put a healthy discrete plant at 95 percent or better.
Slice it three ways before you act: by line, by shift, and by defect type. If night shift sits four points below day shift on the same equipment, that is a staffing or setup question. If one defect code accounts for most of the loss, that is a process question and probably a fixable one.
4. Scrap and Rework Rate
Scrap and rework quantify what defects cost you. Scrap is material thrown away at full value; rework is material that stays but consumes extra labour, cycle time and machine capacity. Rework looks cheaper on a material report and is usually more expensive in reality.
Calculate scrap rate as scrapped units / units produced x 100, and rework rate as reworked units / units produced x 100. Track both separately, and attach a cost to each: scrap at material plus lost labour and machine time, rework at the labour hours it consumed.
Add those two costs up monthly and you have the plant’s cost of poor quality, which usually runs well above what finance shows in the material variance account. When one defect type dominates, the next step is root cause analysis methods for manufacturing defects rather than another retraining session.
5. Cycle Time and Takt Time
Cycle time is the average time to produce one unit; takt time is the pace customer demand requires. The gap between the two tells you whether equipment or process design is the constraint.
Standard cycle time comes from the engineered ideal, actual cycle time from the machine or manual observation. Takt is available production time per day / customer demand per day. With 480 minutes of run time and demand of 200 units a day, takt is 2.4 minutes per unit. A line running a 3.1-minute actual cycle can produce 155 units in that window, no matter how hard anyone pushes.
If actual cycle time exceeds takt on the bottleneck, add capacity, reduce changeover, or cut the changeover frequency. If the line easily beats takt, the problem is elsewhere — often launch, not run rate.
6. Changeover Time
Changeover time is the span between the last good unit of one product and the first good unit of the next. It is pure lost capacity, and in high-mix plants it routinely exceeds the time spent actually producing.
Measure it per product family and split the work into internal tasks that happen while the machine is stopped — die changes, tooling, first-article checks — and external tasks that can happen in parallel, like staging material or setting the machine parameters. The SMED approach works by converting external work into internal work, in the order of easiest to hardest.
Track the total, then track the delta after each improvement. A 95-minute changeover cut to 60 minutes on one product family is the proof that gets the next one funded, especially if you multiply it by annual changeover count and contribution margin.
7. Unplanned Downtime
Unplanned downtime is any stoppage the schedule did not include: breakdowns, jams, material starvation, operator absence. Planned maintenance does not count against it.
Capture two fields for every event: duration in minutes and a cause category. Durations tell you the cost, and Pareto analysis on the categories tells you where to spend. Fixing the top cause often removes half the total minutes on a typical shop floor.
Pair the log with MTBF and MTTR to see whether reliability is improving or just getting patched. The mechanics of that calculation are covered in how to calculate MTBF and MTTR for manufacturing equipment.
8. Preventive Maintenance Compliance
PM compliance is the share of scheduled preventive maintenance tasks completed on time. It is easy to measure and easy to game, which is why it works best as a health check rather than a score.
Calculate it as PM tasks completed on time / PM tasks scheduled x 100. Anything above 90 percent is a reasonable target for a plant without competing constraints.
Compliance and equipment health are not the same thing. A plant that hits 100 percent by rescheduling tasks until they fit between production runs has not improved reliability, it has just recorded better paperwork. Read compliance alongside unplanned downtime and MTBF: if compliance rises while downtime does not fall, the maintenance program is being redefined to look good.
9. On-Time Delivery and Order Fill Rate
On-time delivery measures whether orders shipped by the promised date; order fill rate measures whether the full quantity shipped complete. Running both stops a plant from claiming perfect on-time delivery while shipping partial orders every week.
On-time delivery is orders shipped on or before the promise date / total orders due x 100. Order fill rate is units shipped complete / units ordered x 100. On-time in-full, or OTIF, requires both at once and is the version most customer scorecards use, so targets of 95 to 98 percent or higher are common.
When the number drops, split the miss into internal and external causes before arguing about it. A late raw material shipment, a customer-requested date change or a carrier miss are not the same problem as a line that ran out of capacity, and only one of them is yours to fix.
10. Inventory Accuracy and Inventory Turns
These two work as a pair. Inventory accuracy says whether you know what you have; inventory turns says whether that stock moves fast enough to be worth its cost.
Accuracy is locations with matching record and physical count / locations counted x 100. Count a representative sample each month rather than only at year-end, since accuracy that holds all year but breaks after the last count is an accounting fiction. In practice, anything above 95 percent is a solid number, and 98 percent is achievable in a well-run warehouse.
Turns are cost of goods sold or issued / average inventory value. Pair turns with a service target: cutting turns by tightening everything from the max-stock level down usually shows up later as a stock-out. A lean balance for most discrete plants sits somewhere between six and twelve turns a year, and the right number depends far more on lead time than on preference.
11. Safety Performance
Safety belongs in the KPI set, but reducing it to one number hides the useful signal. Track leading indicators — hazards corrected before anyone gets hurt, near misses reported, safety observations closed on time — next to lagging ones like recordable incident rate and days without injury.
Recordable incident rate is usually calculated as recordable cases multiplied by 200,000 and divided by total hours worked, the OSHA recording convention. Near miss rate is the count of near misses divided by hours worked. Corrective action closure is the share of findings from inspections closed with evidence, not just marked done.
The pairing matters because lag is slow and leading is fast. A plant that only watches recordable rate hears about a hazard once somebody has already been hurt; a plant tracking hazard corrections hears about it the week someone notices it.
12. Manufacturing Cost per Good Unit
Cost per good unit tells you what one acceptable unit actually costs to make. It is the number that ties everything above it back to margin, because scrapped material and rework labour land in it even though neither shows up on the production report.
Conversion cost per unit is (labour + overhead + energy in production area) / good units produced. Total cost per good unit adds material. The denominator must be good units, not total units produced — using total units makes defects look free.
A quick sanity check: if a line produces 10,000 units and 400 are scrapped, the cost per good unit rises by about 4 percent before anyone looks at the numbers. Now add rework hours and overtime caused by the same defects and the real increase is usually higher. That gap is the conversation to have with finance.
Frequently Asked Questions
What are the most important manufacturing KPIs for a plant?
For most plants, five cover the critical path: OEE, first pass yield, schedule adherence, unplanned downtime and on-time delivery. Together they tell you whether machines are producing good parts, whether quality holds, whether the plan is met, where failures come from, and whether customers get what they were promised. Add cost per good unit when finance and operations need a shared number, and safety indicators when the site is covered by a formal safety program.
How many KPIs should a manufacturing plant track?
A plant manager can actually manage somewhere between five and ten KPIs per site. Beyond about a dozen, review meetings turn into number-reading sessions and nothing gets decided. Track more in the system than you review by hand: collect forty metrics, publish eight, and give each of those eight an owner, a baseline and a target. The rest can feed a monthly trend nobody has to defend in a meeting.
What is the difference between OEE and overall equipment effectiveness?
There is no difference in meaning. OEE is simply the standard abbreviation for overall equipment effectiveness. What plants mean when they conflate the two is usually a different measure, most often throughput efficiency, which compares actual output against theoretical maximum output for the same scheduled time. OEE is the stricter figure because it removes planned breaks and counts only good parts, which is why it sits lower than an output-based percentage.
Should a plant track only KPIs or also operational metrics?
Track both, at different resolutions. KPIs are the handful of outcome measures a plant manager is accountable for and reviews on a schedule. Operational metrics are the diagnostic detail — cycle times by product, downtime reasons by machine, defect counts by code — that you pull out only when a KPI moves. That split keeps the review short while making sure every number on the scorecard has an explanation behind it when someone asks.
How often should manufacturing KPIs be reviewed?
Match the cadence to how fast the process can respond. OEE, safety and schedule adherence get reviewed daily at the shift or tier meeting. Yield, scrap, downtime causes and cycle time are weekly items, since they need several data points to be meaningful. Cost per good unit, inventory turns and on-time delivery are monthly or quarterly, because they move slowly and there is nothing to act on at a faster cadence.
How do you choose KPI targets for a new plant or production line?
Start from your own history rather than an external benchmark. Run the line or process for four to eight weeks and set the baseline from that data, then set a target a stretch above it, usually five to ten percent within a year. External ranges are useful as a sanity check on whether your baseline is already competitive, but they describe a different process, different products and often different standards.
Conclusion: Start With a Small, Balanced KPI Set
The first move is not a dashboard. Sit down with the people who run the lines and agree on one written definition per metric — because schedule adherence means something different to a planner and a supervisor, and the argument about the number kills the conversation about the cause.
Then pick a balanced set: a couple of production measures, one quality measure, one delivery measure, one cost measure and one safety measure. Assign an owner to each, establish a baseline from four to eight weeks of real data, and put each one on a review cadence the process can actually respond to. Watch the trends rather than the single number, and every KPI on that board should have a named person who changes something when it moves.
These twelve manufacturing KPIs every plant should track cover the losses that quietly consume a plant’s capacity and margin. Start with five, run them honestly for a quarter, then add the rest.