

If you know how to read a psychrometric chart, a dryer is just two state points and a line between them. Measure the air temperature and relative humidity where the air enters and where it leaves, plot both, and the chart hands you the two numbers that decide whether the equipment is keeping up: humidity ratio in grains per pound, and dew point.
Most operators already have the instruments. What they have never had is someone show them which five line families matter out of the forty printed on the sheet. That is the whole job. Give it an hour of practice and a printable IP chart, and the paper becomes faster than opening an app on a phone with wet gloves on.
This guide is written for plastics, coatings and process engineers who need to interpret dryer air conditions in production terms rather than memorize chart theory. It also works for structural drying technicians, kiln operators and anyone sizing a dehumidifier against a moisture load.
Table of Contents
- What You Need
- Step-by-Step: Read a Psychrometric Chart for Dryers
- Common Mistakes
- Frequently Asked Questions
- What two measurements do I need to use a psychrometric chart?
- What do the vertical lines on a psychrometric chart represent?
- Where is humidity ratio on a psychrometric chart?
- What do wet bulb temperature readings indicate?
- What does 80 percent relative humidity actually mean?
- How do I use a psychrometric chart for a kiln or lumber dryer?
- Conclusion
What You Need
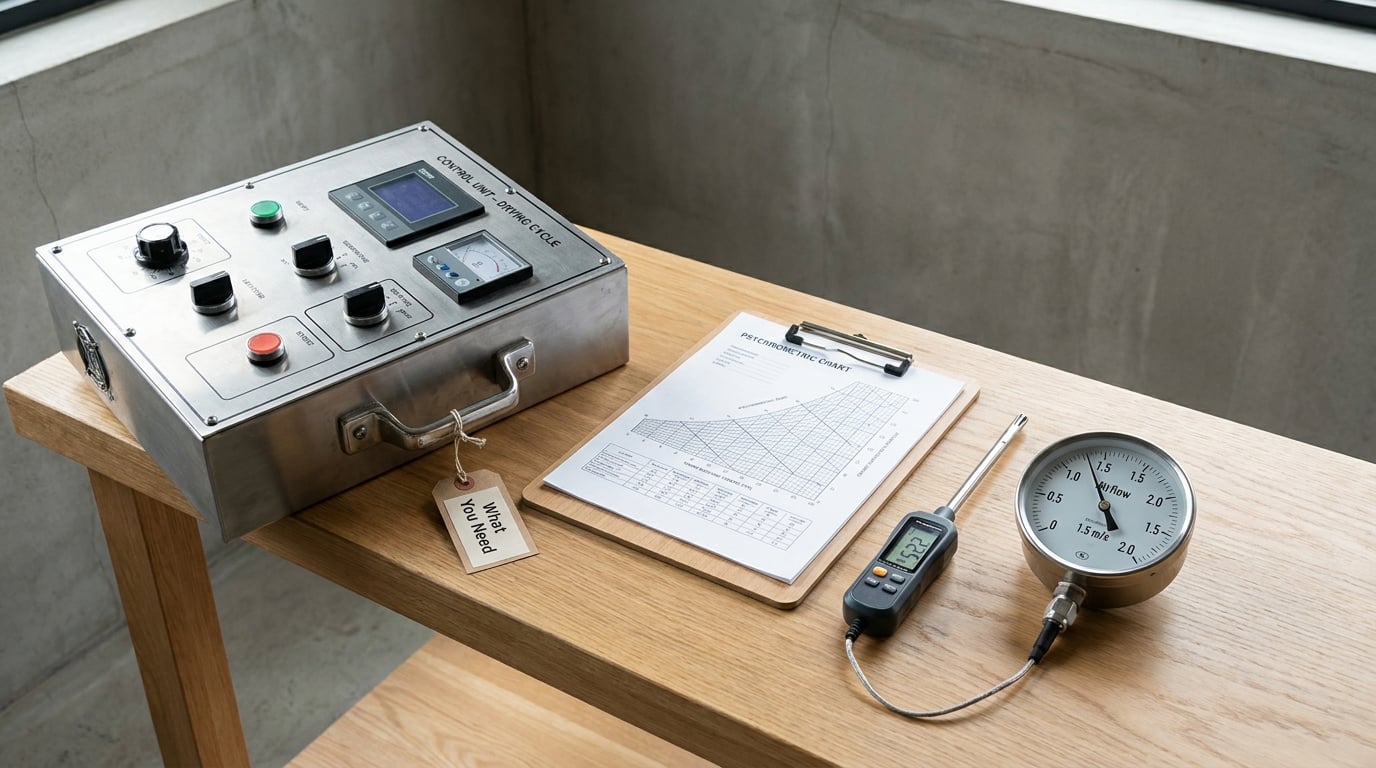
Three things, and none of them expensive. A printed chart at standard atmospheric pressure (sea level, 101.325 kPa / 14.696 psia), a pencil, and a straightedge you can lay across the page. The straightedge matters more than people expect. Constant wet bulb and constant enthalpy lines are too steep and too close together to trace by eye.
Next, two measured properties for each air state. Dry bulb temperature and relative humidity is the easiest pair to get because nearly every handheld hygrometer reports both. Dry bulb plus dew point works too, and wet bulb plus dry bulb is what an aspirated psychrometer or a sling psychrometer gives you directly. ASHRAE’s Fundamentals of Thermodynamics and Psychrometrics is the reference most chart work in North America is built on, and IICRC S500 covers the equipment and monitoring side for water and restoration drying.
IP charts, SI charts, and altitude
The two chart families differ in units, not in physics. An IP chart runs degrees Fahrenheit on the bottom axis and grains of moisture per pound of dry air on the right axis, with enthalpy in Btu per pound of dry air. An SI chart runs degrees Celsius and grams of moisture per kilogram of dry air, with enthalpy in kJ per kilogram of dry air. One gram per kilogram equals seven grains per pound, so 70 g/kg is the same state as 490 GPP. Mixing the two is the single most common self-inflicted error, and it usually shows up as a moisture load that is seven times larger than reality.
Both families are drawn for sea level. At altitude the barometric pressure drops, the air holds less water at the same temperature, and a sea-level sheet will overstate the moisture your air actually carries. Denver at 5,280 feet reads roughly 17 percent lower absolute humidity than the same conditions at the coast. For control decisions that gap matters; for a first pass on a dryer it usually does not. Use a chart printed for your site elevation if you have one, and treat a sea-level sheet as a slightly optimistic estimate everywhere else.
Chart, calculator, or app?
Use all three, for different jobs. The paper chart is for understanding a process: seeing that heating and humidifying are not the same direction, and that a line of constant wet bulb is the ceiling on evaporative cooling. A calculator or app is for production: repeated moisture load calculations, logged data, and readings you need to keep a record of. Most phone apps are accurate at sea level and assume it, so the same altitude caveat applies. What an app will not do is show you that the air leaving your dryer is sitting on the saturation curve when you thought it had headroom.
Step-by-Step: Read a Psychrometric Chart for Dryers
Every point on a psychrometric chart is one state of air, and the line families for every property are drawn so they all pass through that state. Two known measurements are enough to find the point; the chart supplies the rest. Here is the sequence I use on a dryer panel, in order.
Step 1: Identify the Chart Scales and Units
Before you plot anything, know which four scales you are reading. The bottom horizontal axis is dry bulb temperature, and every state point sits somewhere directly above it. The right vertical axis is humidity ratio, either grains per pound of dry air (GPP) or grams per kilogram. The heavy curved boundary on the right is the saturation curve at 100 percent relative humidity, and nothing plots to the right of it. The diagonal lines running from lower left to upper right are constant wet bulb and constant enthalpy. Relative humidity curves arc across the chart between the bottom axis and the saturation curve, and constant dew point lines are straight diagonals running the other way, from the saturation curve down toward the bottom left.
Saturation is the reference everything else hangs from. On the curve, dew point equals dry bulb, wet bulb equals dry bulb, and relative humidity is 100 percent. If your plotted point lands on that curve, the air is holding as much water as it physically can at that temperature, and the process has no drying margin left.
Step 2: Plot the Inlet and Outlet Air Conditions
Take your inlet reading first, before the dryer is running, with the probe in the supply airstream and the unit stabilized. Find the dry bulb value on the bottom axis, run your finger straight up, and note where you are. Now find the relative humidity curve for your reading and follow it across until it meets that vertical. That intersection is your inlet state point. Pencil it. Do not skip the marking, because every read after this one is traced from it.
Confirm the plot before trusting it. Slide horizontally right from the point to the humidity ratio axis and record the GPP. Drop vertically from the point to the bottom axis to confirm dry bulb. Trace the nearest wet bulb diagonal and read its value at the right scale. If those three agree with your instrument, your chart and units are correct. If the wet bulb you traced does not make physical sense (wet bulb below dry bulb is impossible), you picked the wrong diagonal or the wrong chart.
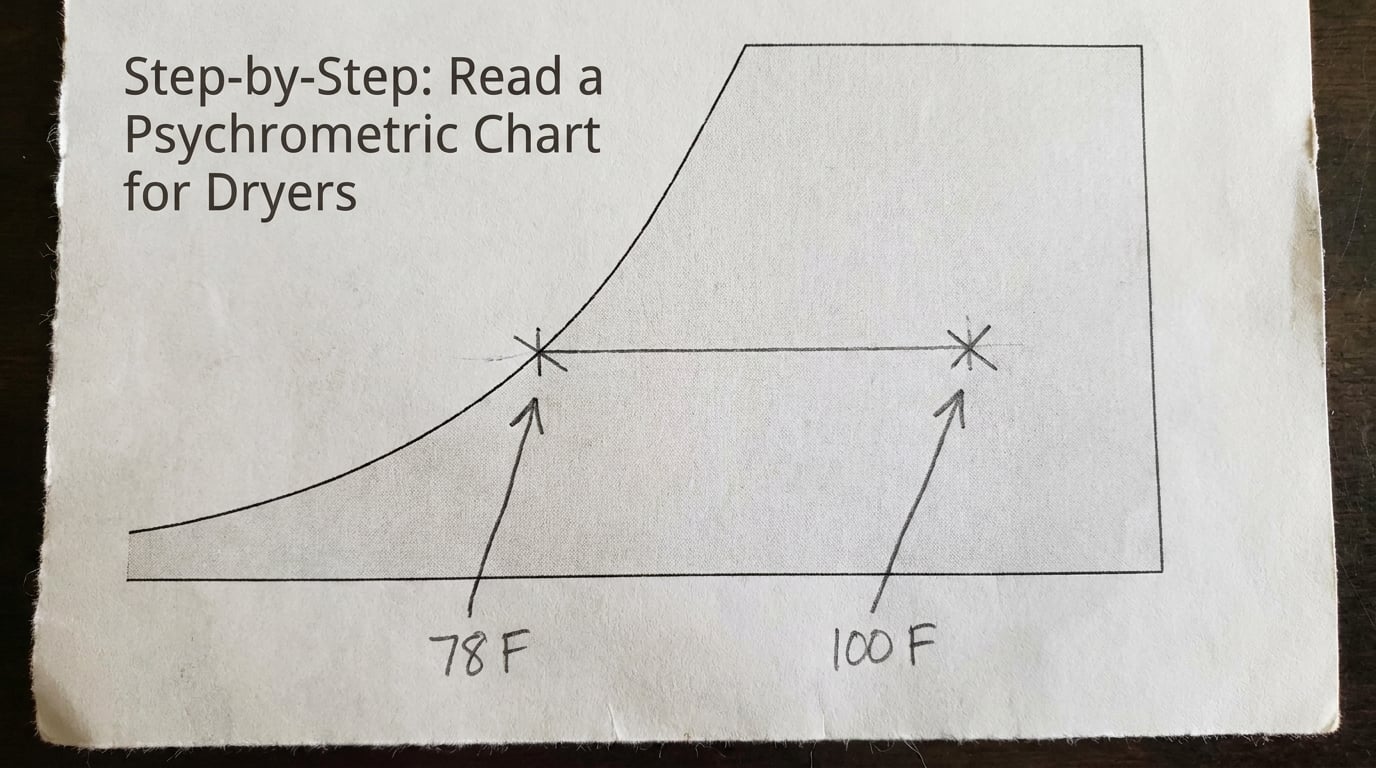
Worked example, inlet air at 78 F and 65 percent RH. Plot 78 F on the bottom axis, follow it up to the 65 percent RH curve, and mark the point. Sliding right gives roughly 92 GPP, which is 13.1 g/kg. Dropping straight down to the wet bulb scale gives about 69 F, so the wet bulb depression is 9 F. Tracing to the dew point scale gives a dew point near 64 F. Enthalpy works out to about 25.4 Btu per pound of dry air. Five properties, one dot, no more than a minute.
Now do exactly the same thing for the outlet air, measured where the drying air actually leaves the chamber and before it mixes with room air. A probe hung in the middle of a building gives you a blend of outlet air and room air, which is why the dew point a technician reads in one room can differ from the next room by several degrees. Two state points from the same chart are worth more than six hygrometer readings scattered around a structure.
Step 3: Trace the Drying Path
Draw a line between the inlet and outlet points. That single line tells you what the dryer is doing to the air, and the shape of it tells you whether the equipment can keep pace with the moisture load.
A path that moves right and up means the air is both heated and gaining moisture: the normal condition inside a drying chamber where warm air leaves carrying evaporated water. A path that moves right and down means the air is being heated and dehumidified at the same time, which is exactly what a recirculating dehumidifier loop does when it delivers warm dry air. A path straight down is pure dehumidification, cooling at constant humidity ratio, and you will rarely see it. A path along a constant wet bulb diagonal is evaporative or adiabatic cooling, the air picking up moisture while giving up sensible heat.
One caution about direction. Relative humidity alone tells you almost nothing about whether a dryer is working, because RH falls as air heats even when the moisture load is unchanged. That is why a recirculating dryer can show dropping humidity numbers while the product gets wetter somewhere downstream. Always judge the path on the humidity ratio axis.
Step 4: Estimate Moisture Removal and Drying Impact
The difference in humidity ratio between outlet and inlet is the moisture the air picked up, expressed per pound of dry air. Continuing the example: if outlet air reads 100 F at 130 GPP against an inlet of 92 GPP, the air gained 38 GPP, or 5.4 g/kg. Multiply by mass flow and you get a moisture removal rate.
Mass flow comes off the chart too. Use the specific volume scale, which gives cubic feet per pound of dry air, and then:
Water removed per hour = (airflow in CFM x 60 / specific volume) x change in GPP / 7000
With 1,000 CFM at about 14.5 cubic feet per pound of dry air, that works out to roughly 4,100 pounds of dry air per hour. At a 38 GPP difference, moisture removal lands near 82 pounds of water per hour. For a plastics dryer running a few hundred pounds of product per hour, that is comfortable capacity. For a coating line pulling water out of a heavy aqueous formulation, it may not be, and the chart is how you find out before the schedule slips.
The same calculation in reverse is a sizing exercise. If you know the evaporation rate from the product and the throughput, you can work out the GPP spread the air must absorb, and whether your measured spread matches. When the measured spread is smaller than the calculated requirement, the dryer is under-sized, the residence time is too short, or the product is wetter going in than the recipe assumes.
Step 5: Compare the Readings with Product and Equipment Limits
Now check the plotted conditions against the limits that actually decide the outcome. Three comparisons cover most of it.
Product temperature limit against air temperature. Resin suppliers publish a maximum melt or drying temperature and a residence time at that temperature. A dryer delivering 140 F air to a resin rated for 120 F may meet the moisture spec and still degrade the material, and the chart will not warn you. The chart tells you what the air is doing; the data sheet tells you whether that is allowed.
Condensation risk against dew point. If any surface the air touches sits below the outlet dew point, water condenses on it. In a drying chamber that is a fouling and microbial growth problem; on a cold pipe or a wall it is a corrosion and mold problem. IICRC S500 exists because condensation on cold surfaces after water damage causes exactly that secondary damage, and dew point is the number that tells you whether you have a condensation problem at all.
Air-mover capacity against wet bulb depression. Air movers evaporate water, and evaporation cools the air. The cooling limit for a given air stream is its wet bulb temperature, so wet bulb depression is the honest measure of how hard your air movers can work. A 9 F depression is healthy, and pushing the room toward saturated conditions closes that gap and slows evaporation even though the air temperature still reads comfortable. When RH climbs past roughly 80 percent, growth risk rises quickly and the air movers lose capacity, which is the practical reason dehumidification beats ventilation once a structure is wet.
Common Mistakes
Treating the whole chart as required. The saturation curve, the dry bulb axis, the humidity ratio axis, the RH curves and the wet bulb diagonals do almost all the work. Dew point, enthalpy and specific volume lines can stay unread until you need them. Beginners stall because they are trying to use every line at once, and the sheet turns into spaghetti.
Confusing the saturation curve with a 100 percent or 90 percent RH line. The saturation curve is the solid boundary, and it is steep. Every other RH curve is a flatter arc that ends at that boundary. The giveaway is slope: if your line climbs almost vertically, you are on the saturation curve.
Sliding the wrong direction to read dew point. Dew point is a diagonal line you trace backward to the saturation curve, then drop straight down to the bottom axis. The common mistake is to trace to the right, toward the humidity ratio axis, and read the value there. That is humidity ratio, not dew point. The two answers are related, but only one of them is a temperature.
Reading humidity ratio off the bottom axis. The bottom axis is dry bulb temperature. GPP lives on the right axis, and specific volume lives on the left. The rule that prevents this: horizontal travel reads the vertical axes, vertical travel reads the horizontal axis.
Trusting relative humidity as a performance number. RH is a ratio that changes with temperature, so it moves even when the moisture content does not. Compare GPP in against GPP out, and use RH only to judge the product’s risk of absorbing moisture or condensing.
Using a sea-level chart at altitude and never correcting. The error is small in relative terms, around 17 percent lower absolute humidity at 5,000 feet, but it is always in the same direction: the chart tells you there is more moisture in the air than there is. A dryer sized that way comes in slightly oversized, which is a mild sin compared with the reverse.
Plotting the outlet condition from a probe in the room. You get a mixture of process air and ambient air, so the state point is real but it is not the outlet state. Move the probe to the actual discharge.
Two habits make all of this faster. Mark every point with a pencil and label the GPP next to it, so the next person can see your work. And sanity-check against the physics: wet bulb never exceeds dry bulb, dew point never exceeds dry bulb, and RH at 100 percent means you are sitting on the saturation curve with no margin left.
Frequently Asked Questions
What two measurements do I need to use a psychrometric chart?
Any two independent properties fix a single air state. The easiest pair is dry bulb temperature and relative humidity, since most handheld hygrometers report both. Dry bulb with dew point also works, as does wet bulb with dry bulb if you are using a sling psychrometer. Once the two values are plotted, their intersection is the state point, and every other property on the chart passes through it.
What do the vertical lines on a psychrometric chart represent?
The vertical lines are constant dry bulb temperature readings, and they run straight up from the bottom axis. Following one upward holds the temperature fixed while humidity changes. The other line families work the same way in a different direction: constant humidity ratio is horizontal off the right axis, constant wet bulb and constant enthalpy are steep diagonals, and constant dew point runs diagonally the opposite way.
Where is humidity ratio on a psychrometric chart?
On the right-hand vertical axis, in grains of moisture per pound of dry air on an IP chart or grams per kilogram on an SI chart. To read it, plot your state point, then travel horizontally to the right until you hit that axis. The value is the absolute moisture the air is carrying, which is the number you use for dryer moisture loads and dehumidifier sizing.
What do wet bulb temperature readings indicate?
Wet bulb is the temperature an air stream approaches when water is evaporating from a wetted surface into it, so it reflects both temperature and available moisture. The gap between dry bulb and wet bulb, called wet bulb depression, tells you how much evaporative cooling is available. In a drying application, a large depression means air movers have capacity; a small one means the air is already close to saturated.
What does 80 percent relative humidity actually mean?
It means the air holds 80 percent of the maximum water vapor it could hold at that temperature, not that the room is 80 percent wet. Raise the temperature and the same air drops to a much lower RH with no moisture removed at all. This is why RH alone cannot size a dryer, and why condensation risk has to be judged against dew point rather than relative humidity.
How do I use a psychrometric chart for a kiln or lumber dryer?
Plot the entering air condition and the target leaving air condition, then read the humidity ratio at each end. The difference in GPP is the moisture the air can carry away per pound of dry air, and multiplying by the air mass flow gives the kiln drying rate. Compare that with the moisture you need to remove from the charge, and check that the target air temperature stays inside the species temperature limit for the schedule you intend.
Conclusion
Start with the simplest possible version of how to read a psychrometric chart for a dryer: measure dry bulb and relative humidity at the inlet and at the outlet, plot both points, mark the humidity ratio in GPP at each, and draw the line between them. That difference is the moisture the air carried away. Then compare it with the moisture the product gave up, and check the outlet dew point against every cold surface in the path. If the two moisture numbers do not match, your dryer is under-sized, your residence time is short, or the incoming product is wetter than the recipe assumes. Those three findings account for most drying problems I have seen, and the chart is how you tell them apart in a couple of minutes.